

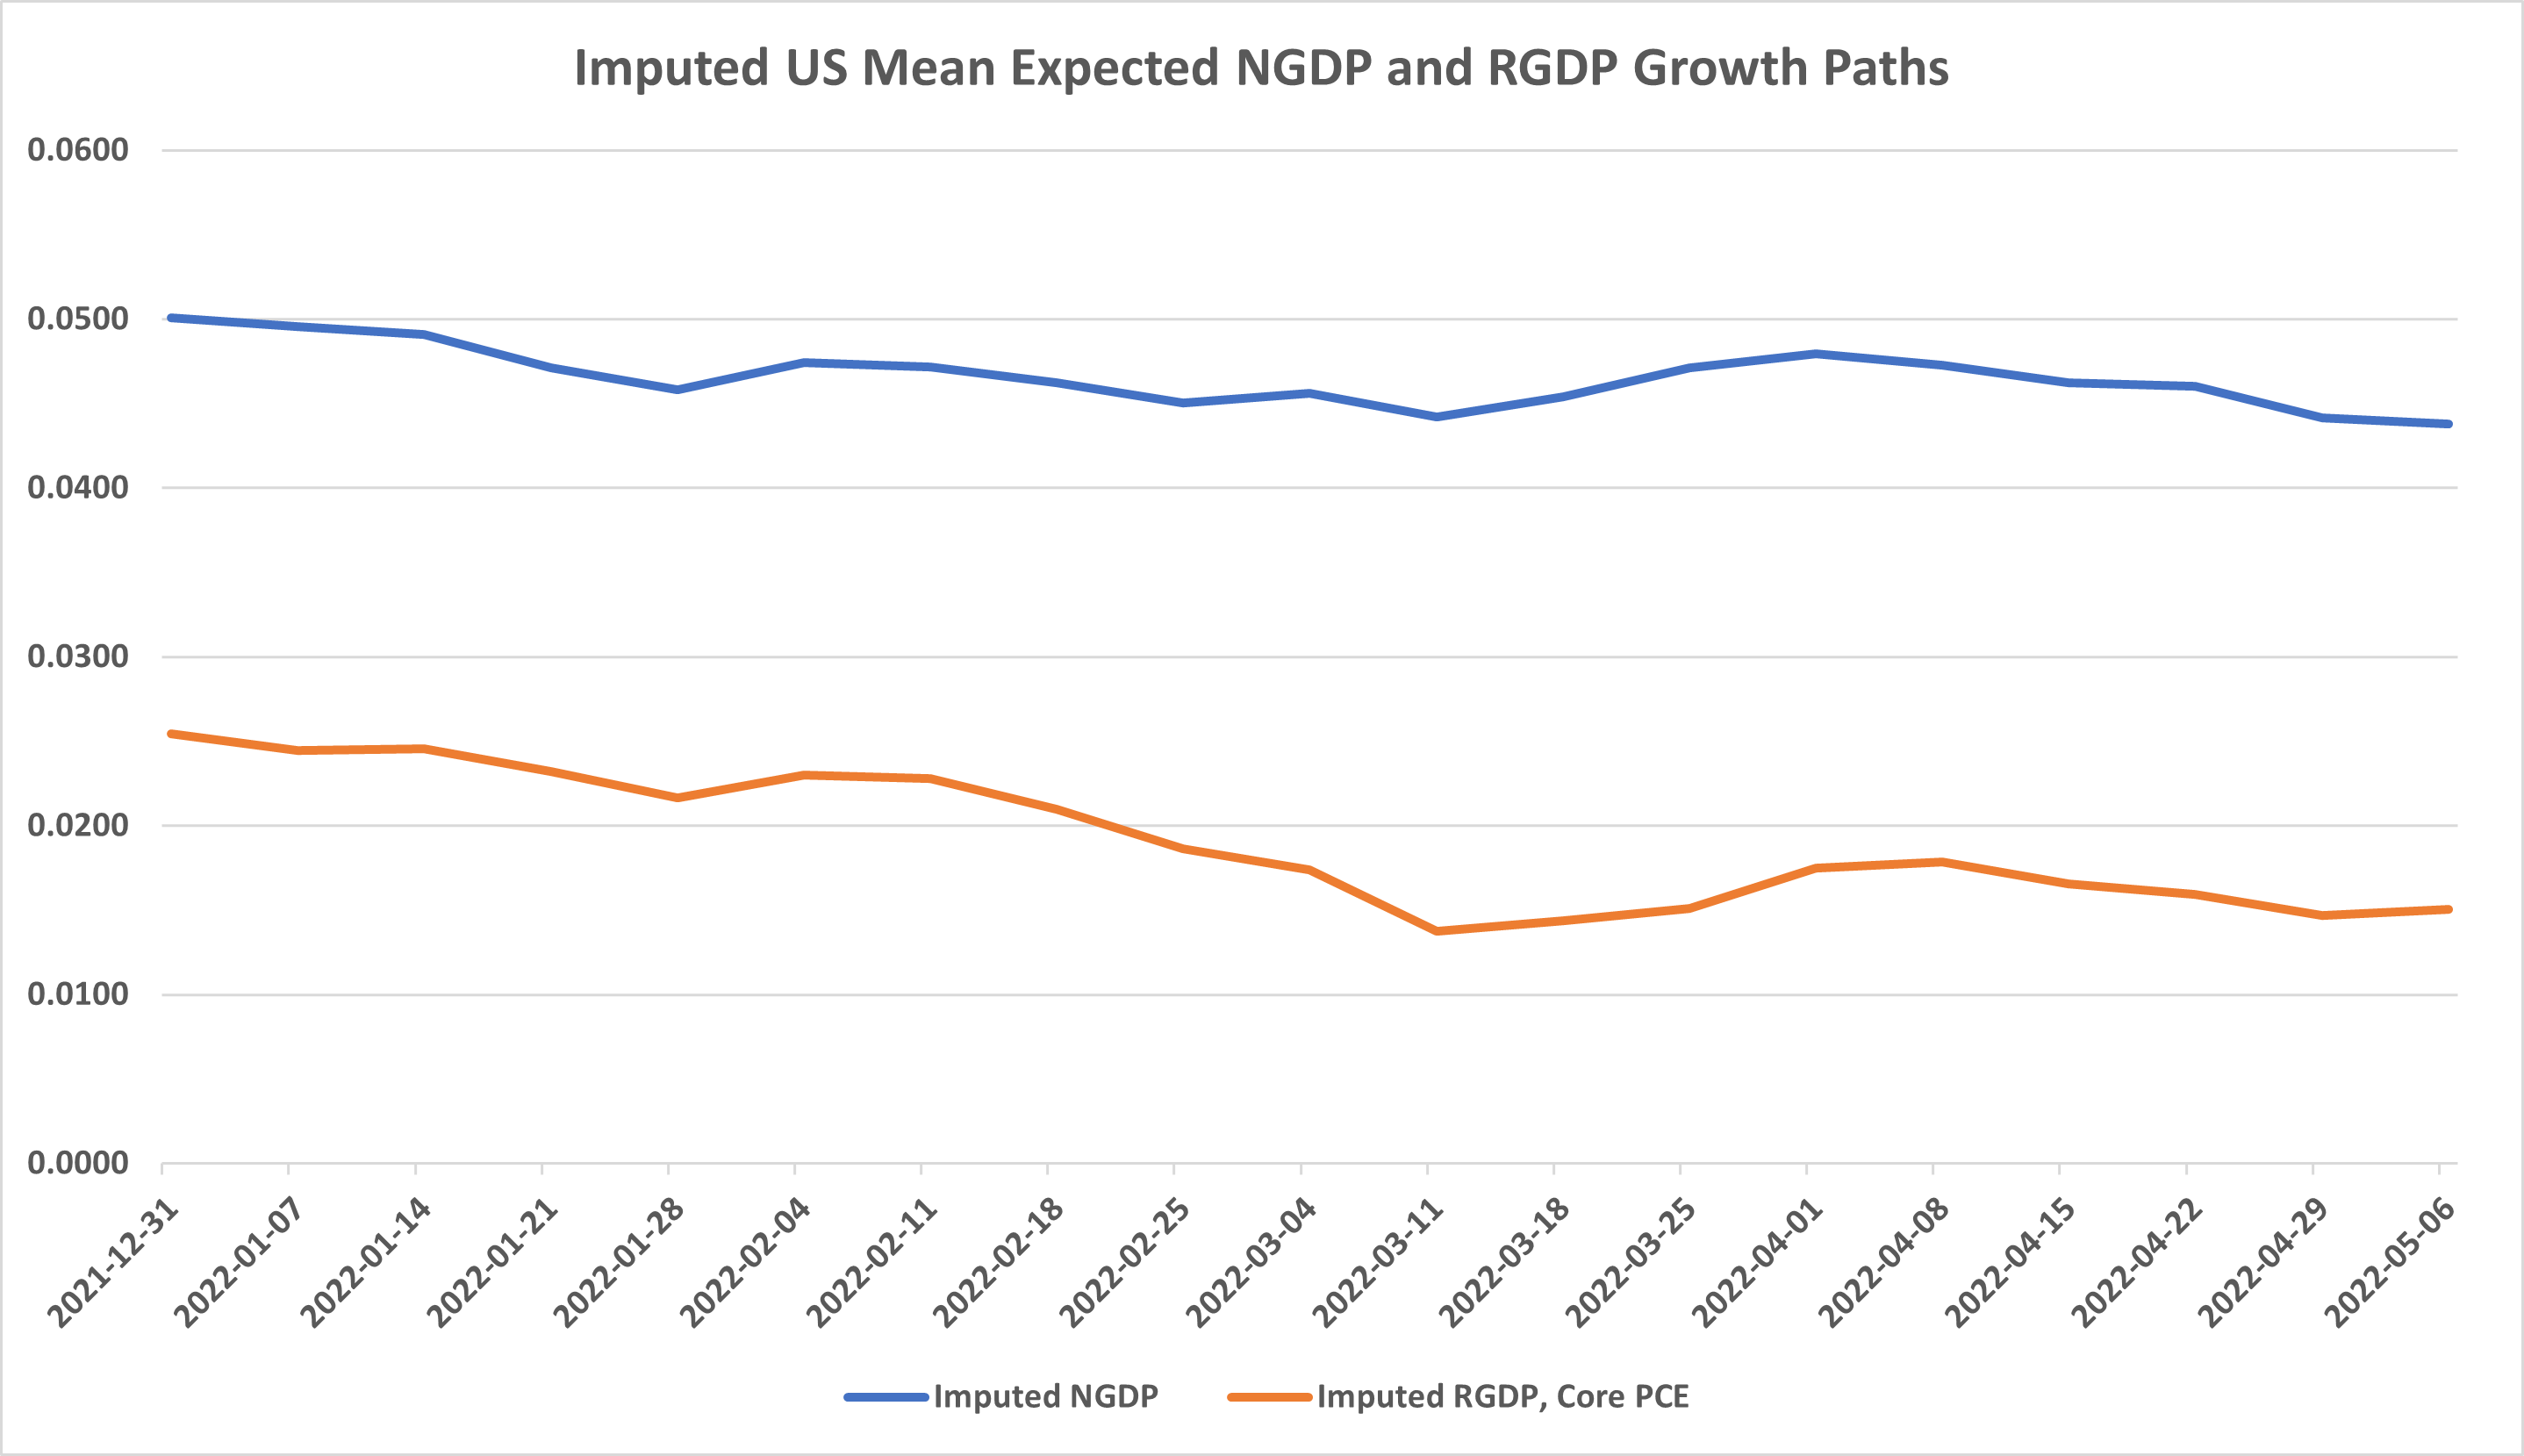
I failed to mention in last week’s stock and GDP outlook that imputed mean expected RGDP had fallen a bit more than 1% in core CPI terms. I usually state changes in inflation expectations in core PCE terms, because that is the Fed’s targeted measure of inflation.
I apologize for the error, but the above chart has the correct figures for imputed mean expected NGDP and RGDP YTD, coming into today. The imputed mean expected RGDP growth rate was about 1.5% as of last Friday, using the 5 year inflation breakeven rate, adjusted to core PCE. Data is provided by FRED.
By the way, if you want to track changes in the mean expected NGDP growth path in close to real time, feel free to check out page I recently put up at gdpforecast.com. It also includes embedded FRED graphs of indicators of interest which are automatically updated daily. I apologize for the crudeness of the site, but I do have a nicer site under development that will also host the stock portfolio stress-tester. More information about that can be found at exactmacro.com.
Note: This post, as is the case with all my posts, should not be construed as offering investment advice. Such advice should be tailored to the individual investor by qualified professionals who, ideally, are fiduciaries.