

Stock prices and the mean expected NGDP growth rate fell last week, amid continuing tariff uncertainty, the cause of which is exemplied in the trade talks with the UK.
For the short of it, the US runs a trade surplus with the UK, but insists on imposing a broad base of 10% tariffs nonetheless. The supposed justification for new tariffs was to balance trade deficits, which won’t work and trade deficits don’t matter anyway. But that’s been covered and logic here seems irrelevant, except for perhaps Trump’s desire to extract concessions, including possible bribes. Rolls Royce gained an exemption. Likewise, it is unclear what Trump hopes to accomplish in his trade talks with China, perhaps even to Trump himself.
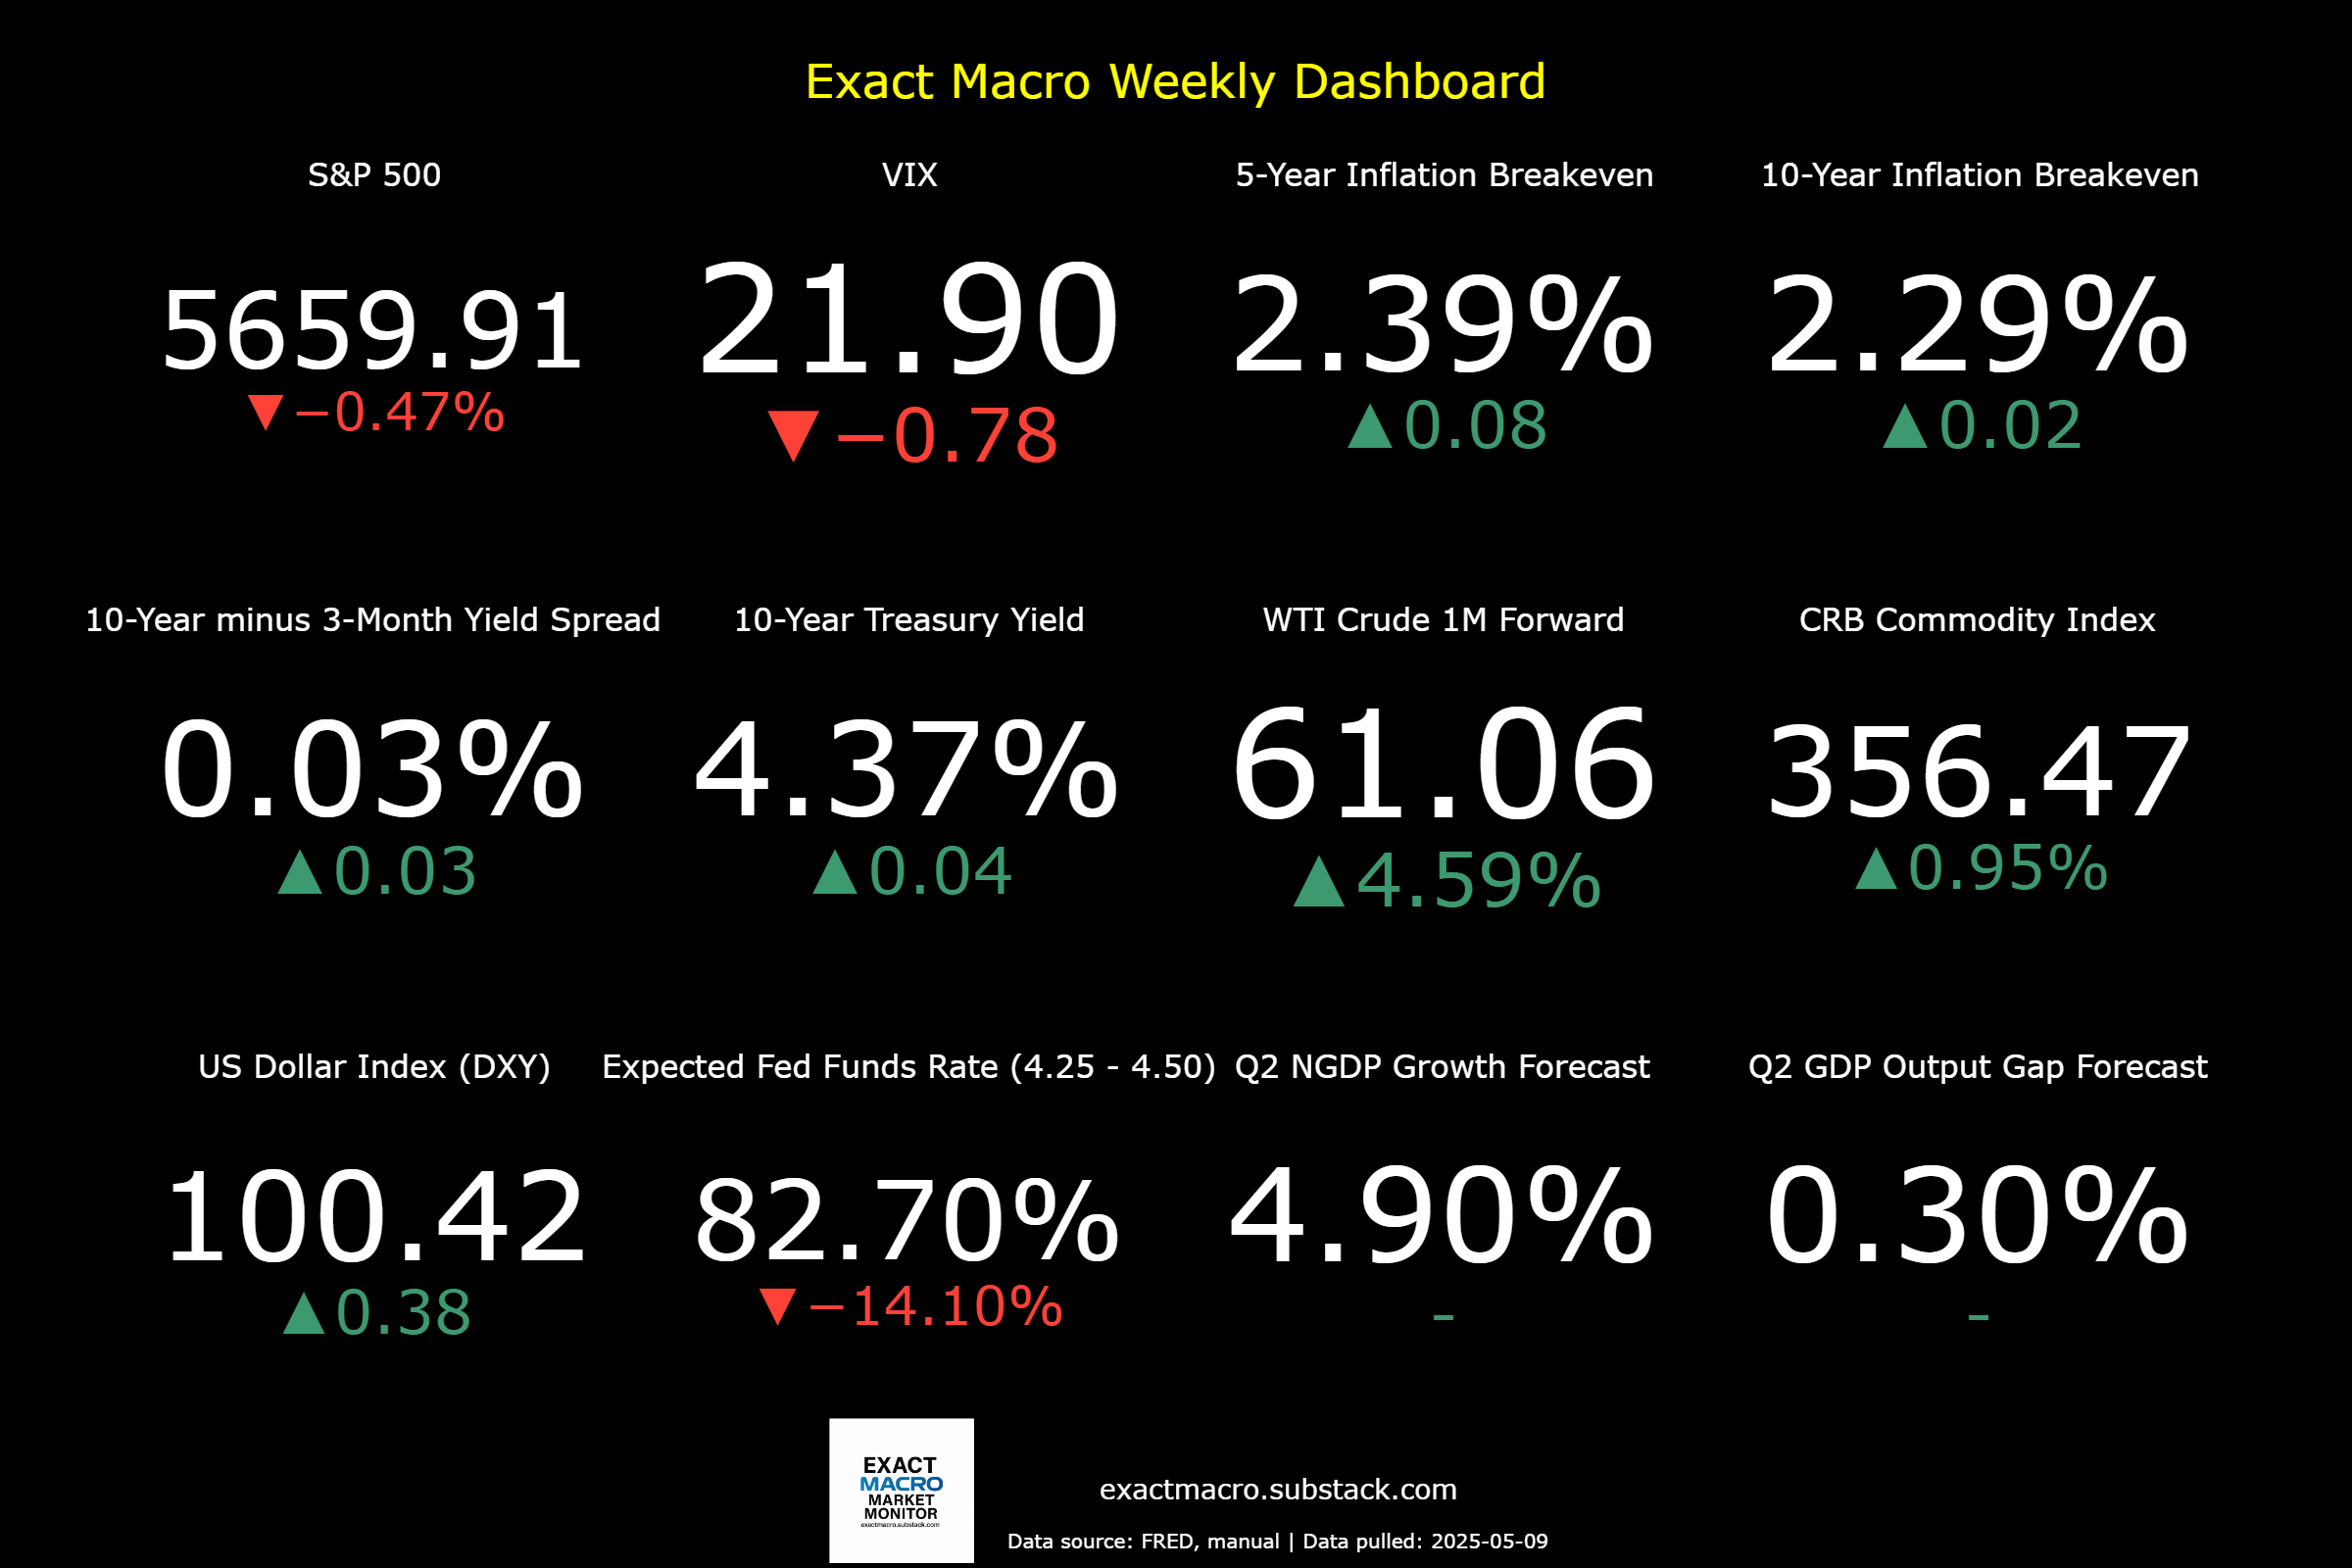
Despite the down week however, stock price volatility eased, suggesting a continued upward trend in investor sentiment. If 10% higher tariffs on average becomes the policy, it is obviously not good for growth, but is not catastrophic either. Trump will have violated his campaign promise to lower prices, but then he also promised tariffs, so he made no coherent promises in this respect. He’s apparently appreciated for his “honesty”, even if it lacks logical consistency.
So, given this continued revelation of a lack of sound basis for policy formation in Washington, it’s hard to be optimistic about the current outlook, despite the lack of a recession prediction. The current clearing of clouds may simply mean we’re in the eye of the storm.
Note: This post, as is the case with all my posts, should not be construed as offering investment advice. Such advice should be tailored to the individual investor by qualified professionals who, ideally, are fiduciaries.
Links to Data:
Studies on Immigration:
https://www.hoover.org/research/economic-effect-immigration
https://www.hoover.org/research/immigration-innovation-and-growth
https://www.epi.org/publication/u-s-benefits-from-immigration/
https://www.nationalacademies.org/news/2016/09/new-report-assesses-the-economic-and-fiscal-consequences-of-immigration
https://www.cbo.gov/publication/60165
https://www.dallasfed.org/research/economics/2024/0702
https://link.springer.com/article/10.1007/s41996-023-00135-x?utm_source=chatgpt.com
https://ideas.repec.org/p/cpm/docweb/2202.html?utm_source=chatgpt.com
Economic Data Sources:
https://fred.stlouisfed.org/series/SP500
https://www.wsj.com/market-data/stocks/peyields
https://www.barchart.com/futures/quotes/ES*0/futures-prices
https://ycharts.com/indicators/sp_500_earnings_per_share_forward_estimate#:~:text=Basic%20Info-,S&P%20500%20Earnings%20Per%20Share%20Forward%20Estimate%20is%20at%20a,28.27%25%20from%20one%20year%20ago.
https://www.cnbc.com/quotes/.VIX
https://fred.stlouisfed.org/series/DTWEXBGS
https://fred.stlouisfed.org/graph/?g=Ee9i
https://fred.stlouisfed.org/series/T10Y3M#0
https://fred.stlouisfed.org/series/DGS10
https://www.cmegroup.com/trading/interest-rates/countdown-to-fomc.html
https://tradingeconomics.com/commodity/crb?user=nunote
https://www.cnbc.com/quotes/@CL.1
https://www.cmegroup.com/trading/en
https://www.spglobal.com/spdji/en/documents/additional-material/sp-500-eps-est.xlsx
https://www.cmegroup.com/markets/interest-rates/stirs/30-day-federal-fund.quotes.html