


Stock and GDP Outlook, for Week Ending 08/04/2023
Modeling the relationship between stock prices, interest rates, and economic growth.

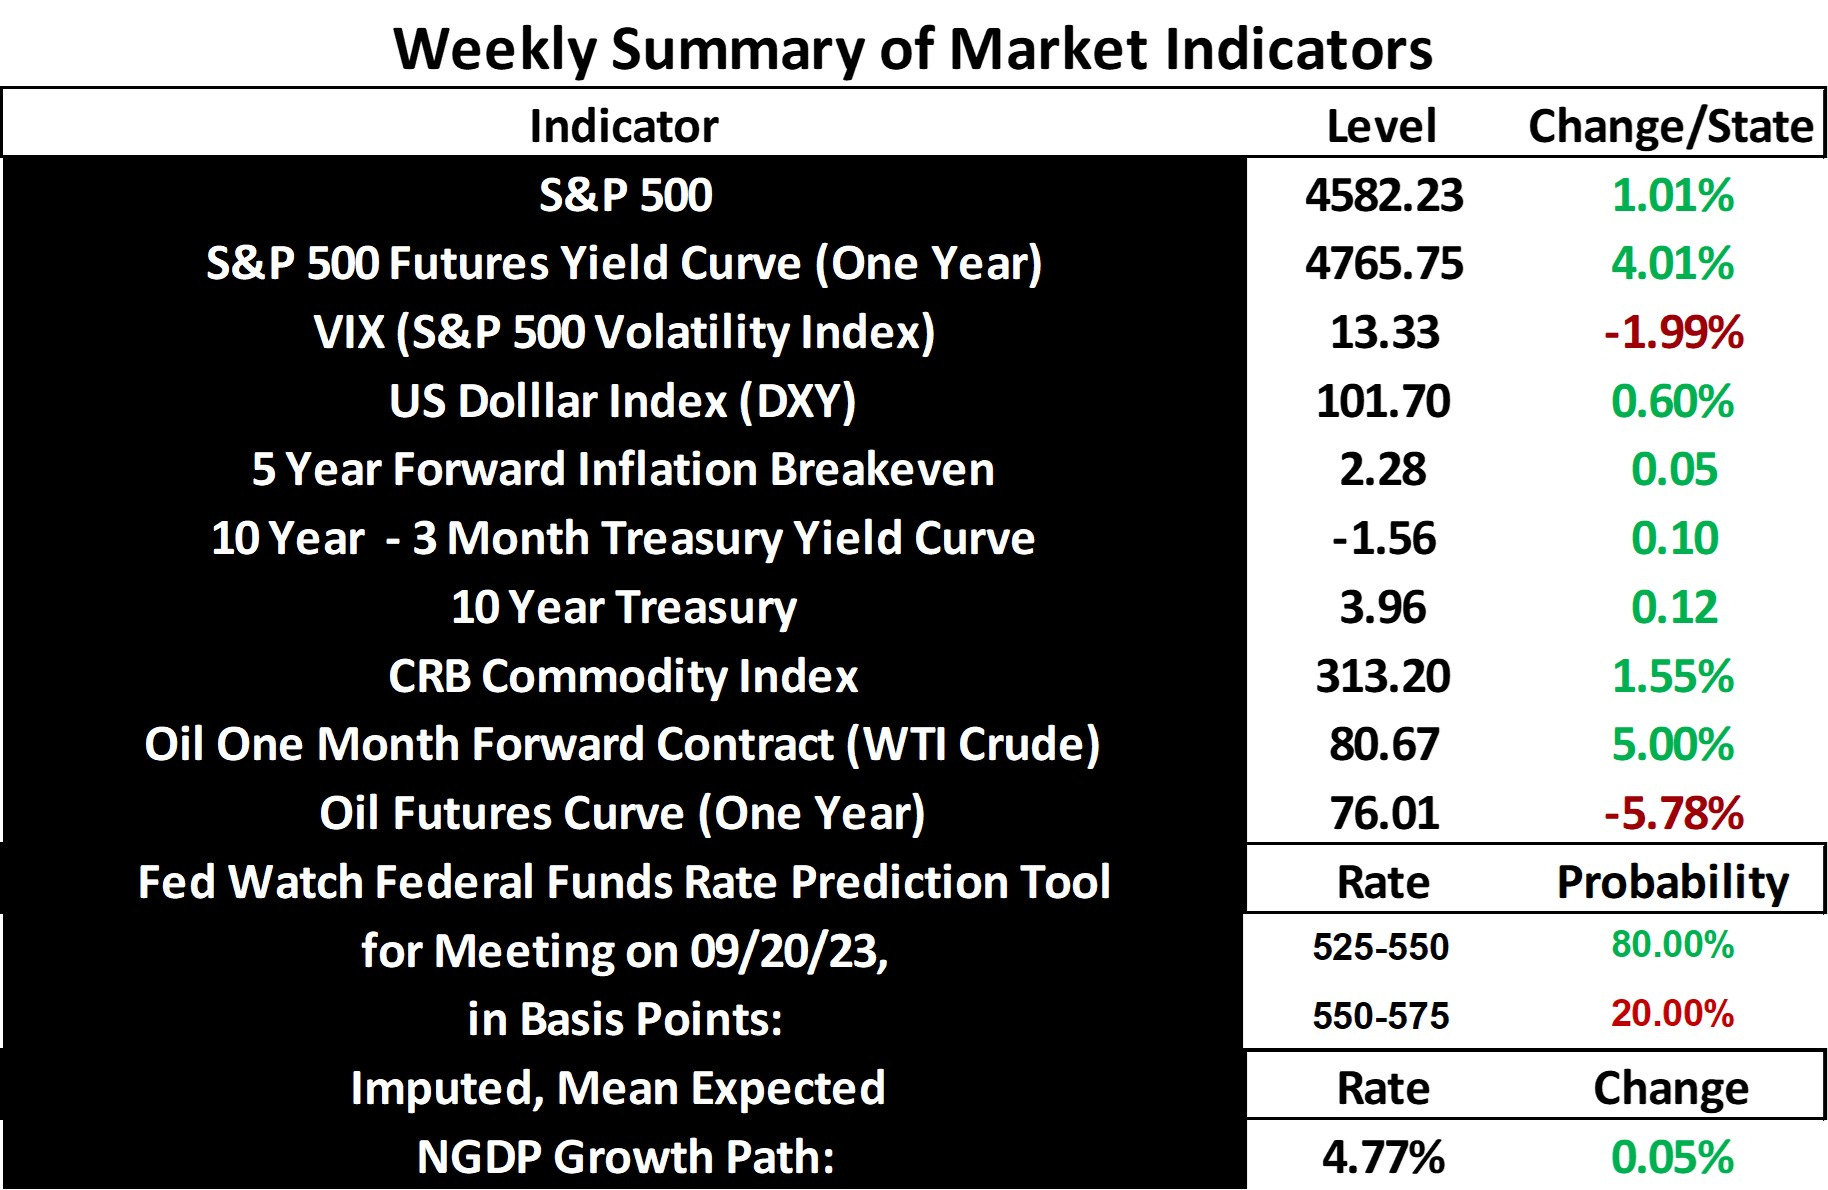
Stocks finished yet another strong week, as the mean expected NGDP growth rate continued its march toward 5%, which was the rate briefly exceeded in late 2021, before the recent tighening cycle. And while inflation expectations again rose a bit, the 5 year breakeven remains just below the Fed’s target in core PCE terms. This was during a week in which last quarter’s real GDP growth surprised on the upside, as last month’s inflation figures were lower-than-expected. Hence, the US economy continues along a strong path, with no signs of recession in sight, despite many remaining, though fading supply-side challenges, and potential new challenges.
Does anyone still expect a recession at this point? Even Jeremy Siegel congratulated Fed Chairman Powell this week, on a job well done. Indeed, while never thinking a recession was likely, due to implicit market expectations, I did think the most likely cause of a recession in the near future was the Fed over-doing the tightening during this cycle. The probability did gradually tick up for a while, but that trend is gone, at least for now. It would be interesting, however, to know what markets think will cause the Fed to start bringing down rates next year, at this point. Presumably, a slowdown, though a soft landing, is still in the offing.
Speaking of rates, I thought I might return to a topic I’ve been addressing for the past few weeks, regarding evidence that monetary policy was too tight, even as late as early 2020, just before the pandemic. That is, that monetary policy was too tight from at least about 2006, until about February of 2020. And a good bit of the evidence I cite is based on stock market variables, though below target inflation and inflation expectations, along with sustained declines in unemployment also represent strong evidence. Hence, I will share more of my thinking about the relationship between stock prices, as represented in very broad indexes like the S&P 500, interest rates, and expected economic growth.
I claimed that the fact that stock prices more than doubled during this period, while nominal and real interest rates fell a bit more than 60%, in the context of a rise in earnings of a mere bit over 30%, supported the claim that lower interest rates alone could not explain the entire rise in stock prices. A counterpoint might be that the ~60% decline in interest rates could indeed explain the entire rise in stock prices, ceteris paribus, using models such as the Gordon growth model. However, one mustn’t ignore the weak rise in earnings, and the Gordon growth model is flawed, especially when applied to broad market indexes, rather than individual stocks.

To address some problems, first the model, as commonly rendered, considers the risk-free rate of return, plus an implicit risk premium. This risk premium is obviously an unobservable variable, sometimes treated as a residual. That can cause enough ambiguity in trying to interpret why stock prices are changing, but this is even a bigger problem considering that the growth rate, “g”, is also an unobservable variable in the context of this model.

Sure, one can plug in a factor such as a volatility metric as a risk premium, but that is also an approach that has its problems, as volatility isn’t necessarily the best measure of risk in all circumstances, for example.
There is also an odd thing about “g” in this model. It is seemingly somewhat redundant when analyzing individual stocks. Dividend or earnings multiples reveal expected growth relative to the S&P 500, but when the model is applied to the S&P 500, “g” is lost in the ambiguous denominator. Also, the model doesn’t exactly work well when “g” is greater than “r”. There’s no such thing as negative stock prices.
More importantly, I want to address what seems to be a common mistake to point to higher earnings or dividend multiples and claim that monetary policy has boosted stock prices with low real interest rates. This can seem true, when the low rates are short-term rates and longer rates have risen, because NGDP growth expectations have risen, for example. However, in an economy that is recovering from a recession and is below its previous NGDP growth trend, such claims are nonsense. In those situations, earnings and earnings growth will be relatively low, as they were during the Great Recession “recovery”.
No example illustrates this point better than Japan, which saw stock prices collapse circa 1990 and never fully recover, despite lower interest rates. The below Nikkei 225 chart comes from macrotrends.net.

Here’s what happened to real and nominal interest rates in Japan after 1990:


And here’s NGDP:

Stock earnings typically fall much further than stock prices in the context of large market declines, more than offsetting rising earnings multiples, which reflect catch up growth expectations.
Here’s a simple model to illustrate how I think about the relationship between interest rates and stock prices. First, however, it’s important to note that interest rates are the result of monetary policy, not the transmission mechanism. The transmission mechanism involves the money supply changes that occur due to Fed open market operations, for example, and/or changes in demand for money due to forward guidance.

“P” refers to the current S&P 500 level, “Price”, “e” refers to earnings, “FFR” refers to the Fed Funds rate, “r*” refers to the nominal equilibrium interest rate and “g” refers to the expected NGDP growth rate. Notice that the earnings yield is a multiplier here.
The two variables which really matter here, as I alluded to above, are earnings and NGDP growth, with the former obviously depending upon the latter. You can substitute change in NGDP growth versus expectations for the interest rate gap above, which is a very market monetarist perspective.
One might complain that equilibrium interest rate and the expected NGDP growth rate are unobservable variables, but again, this model doesn’t require interest rates, and another model I have imputes the mean expected NGDP growth rate. I will discuss that model more in the near future. For now, I’ll say that the chart of NGDP growth expectations looks very much like a chart for the S&P 500 market cap over US NGDP ratio.
I will continue to share my more explicit thoughts on how I see finance and economics in the future, assuming it is welcome. Comments are always welcome in return.
Note: This post, as is the case with all my posts, should not be construed as offering investment advice. Such advice should be tailored to the individual investor by qualified professionals who, ideally, are fiduciaries.
Links to Data:
https://www.cmegroup.com/trading/interest-rates/countdown-to-fomc.html
https://www.cmegroup.com/trading/energy/crude-oil/light-sweet-crude_quotes_globex.html
Share