
Stock and GDP Outlook, for Week Ending 07/12/2024
Real Artificial Growth

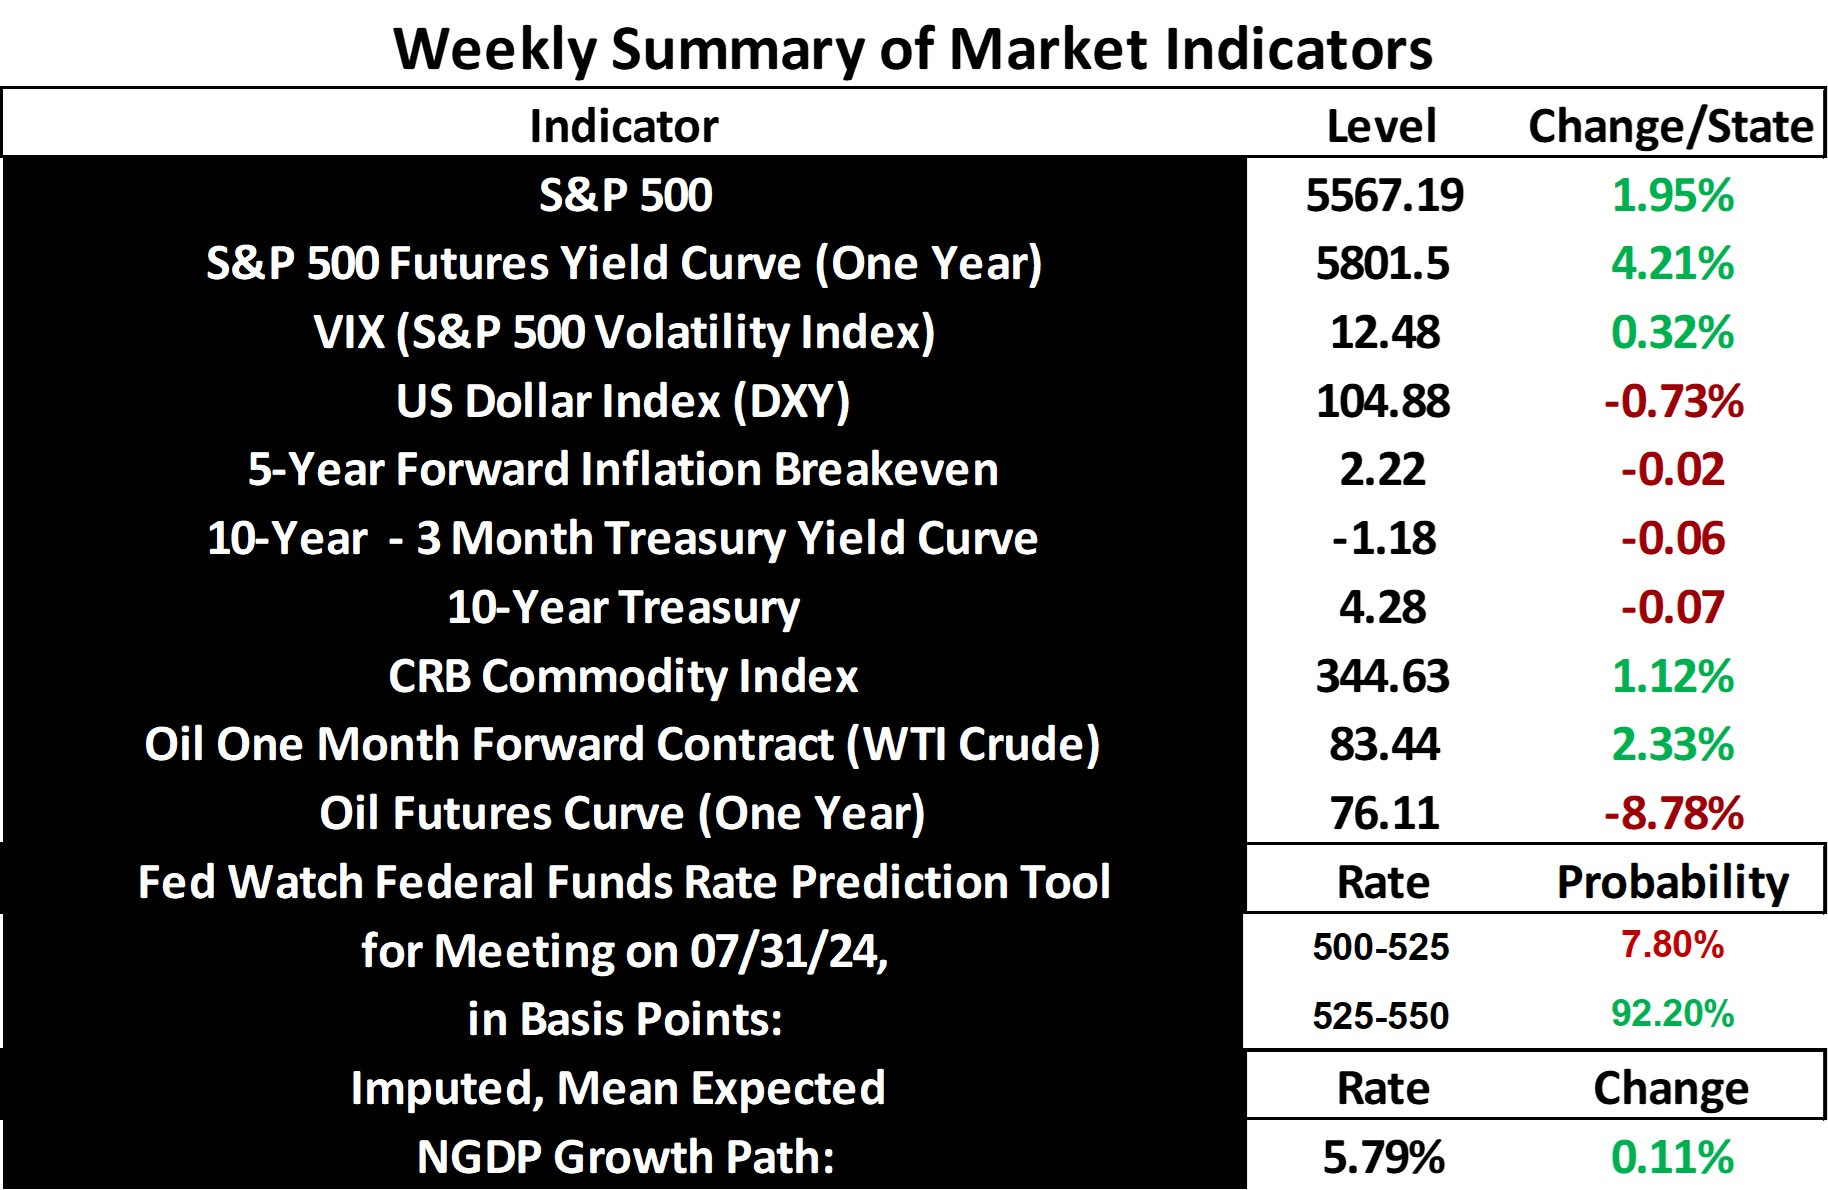
Stock prices and the mean expected NGDP growth rate rose sharply last week, as inflation expectations fell. This was despite a rise in commodity prices, indicating a yet another net positive real shock.
The real shocks have been piling up over the past couple of years, due to an immigration surge and, possibly, the introduction of ChatGPT-3.5 and the AI craze it has stirred since November of 2022. Just look at the turn around in RGDP growth and stock prices.
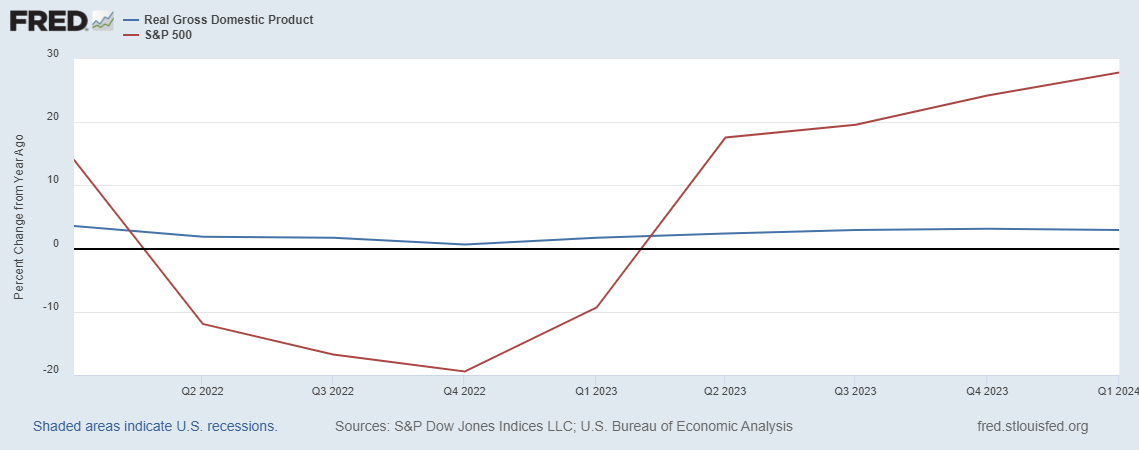
This is obviously despite the trend of falling NGDP growth, due to the tightening of monetary policy.

Currently, the AI craze is primarily boosting RGDP via the investment channel, as evidenced in rapidly rising stock prices, but it will perhaps also begin to contribute noticeably to productivity growth in the near future. Hence, the outlook for future growth and that of stock prices remains bright, especially if additional immediate real shocks continue to occur. Of course, political and geopolitical turbulence remain risks, among the usual risks to growth prospects. NGDP growth is predicted to continue to slow due to continued Fed tightening until about mid-2026, according to Fed Funds futures.
Speaking of stocks and GDP growth outlooks, I was playing with a VAR analysis via ChatGPT-4.o of the ability of changes in the S&P 500 index to predict changes in next quarter NGDP growth figures. The coefficient was ~0.145, with a correlation over 0.25 and a P-value of 0.0003. I’m pretty impressed with this relationship, but more work is needed on the analysis to produce a plausible forecasting model.
In the meantime, Marcus Nunes pointed me to two interesting new blog posts by Lars Christensen. Both suggest ways for the Fed to level target NGDP with implications for forecasting NGDP using high frequency/market data. The first post regards use of the Fed’s Weekly Economic Indicator (WEI) as a proxy for NGDP. The second post regards the use of the Treasury yield curve.
As a data analyst, I improved a demand forecast model using the yield curve for a retail company in the past, so I understand its value as a forecasting tool, but the WEI is new to me. While the correlation in Lars’ graph is impressive, and there are defintely some leading turns in the data in this proxy, the fact is that gaps between them are sometimes quite large. This is particularly true of the period during much of the pandemic recovery.

Using the raw WEI as a proxy for RGDP growth works a bit better for the pandemic recovery period, and has obvious value on its own.

However, a another impressive fit is one I found using the Fed’s GDPNow + the 5-year inflation breakeven, versus quarter-to-quarter NGDP growth.

This is quite an exciting time for advances in macroeconomic forecasting, as models using forward-looking market data and real-time/high frequency data develop. I dare say macroeconomic forecasting may lose its reputation as perhaps the most dismal element in the dismal science.
Note: This post, as is the case with all my posts, should not be construed as offering investment advice. Such advice should be tailored to the individual investor by qualified professionals who, ideally, are fiduciaries.
Links to Data: