
User Guide and Chatbot
Key Indicators for Interpreting Market Forecasts and Economic Growth

Note: No content on this page or this blog is intended as investment advice. Such advice requires taking individual circumstances into account, and should ideally be provided by a fiduciary.
Market Compass Outlook Alerts
Subscribers receive an email with a quick glance dashboard whenever the stock market outlook changes. See here for details.
AI Chatbot Guides
Here is a link to a free user-friendly chatbot to answer questions you have about the blog and how to use it: https://chatgpt.com/g/g-nSi9V55dP-exact-macro-answer-chatbot. Link to free AI chatbot with additional features for investoers: https://chatgpt.com/g/g-nSi9V55dP-exact-macro-premium-chatbot-beta
How to Use this Blog
This blog provides both strategic and tactical signals of sustainability in stock price trends as related to states of disequilibrium in the US economy. States of disequilibrium are caused by unstable monetary policy and follow a familiar pattern in regimes in which central banks target inflation, as does the Fed. Flat inflation rate targeting is pro-cyclical and wages are sticky, so such an inflation target can allow NGDP growth to stray from the long-run trend, over- or under-stimulating the economy and hence causing much instability in stock prices. Sticky wages help cause sticky core prices, as in the Fed’s preferred core PCE inflation metric, such that changes in this metric lag changes in real output.
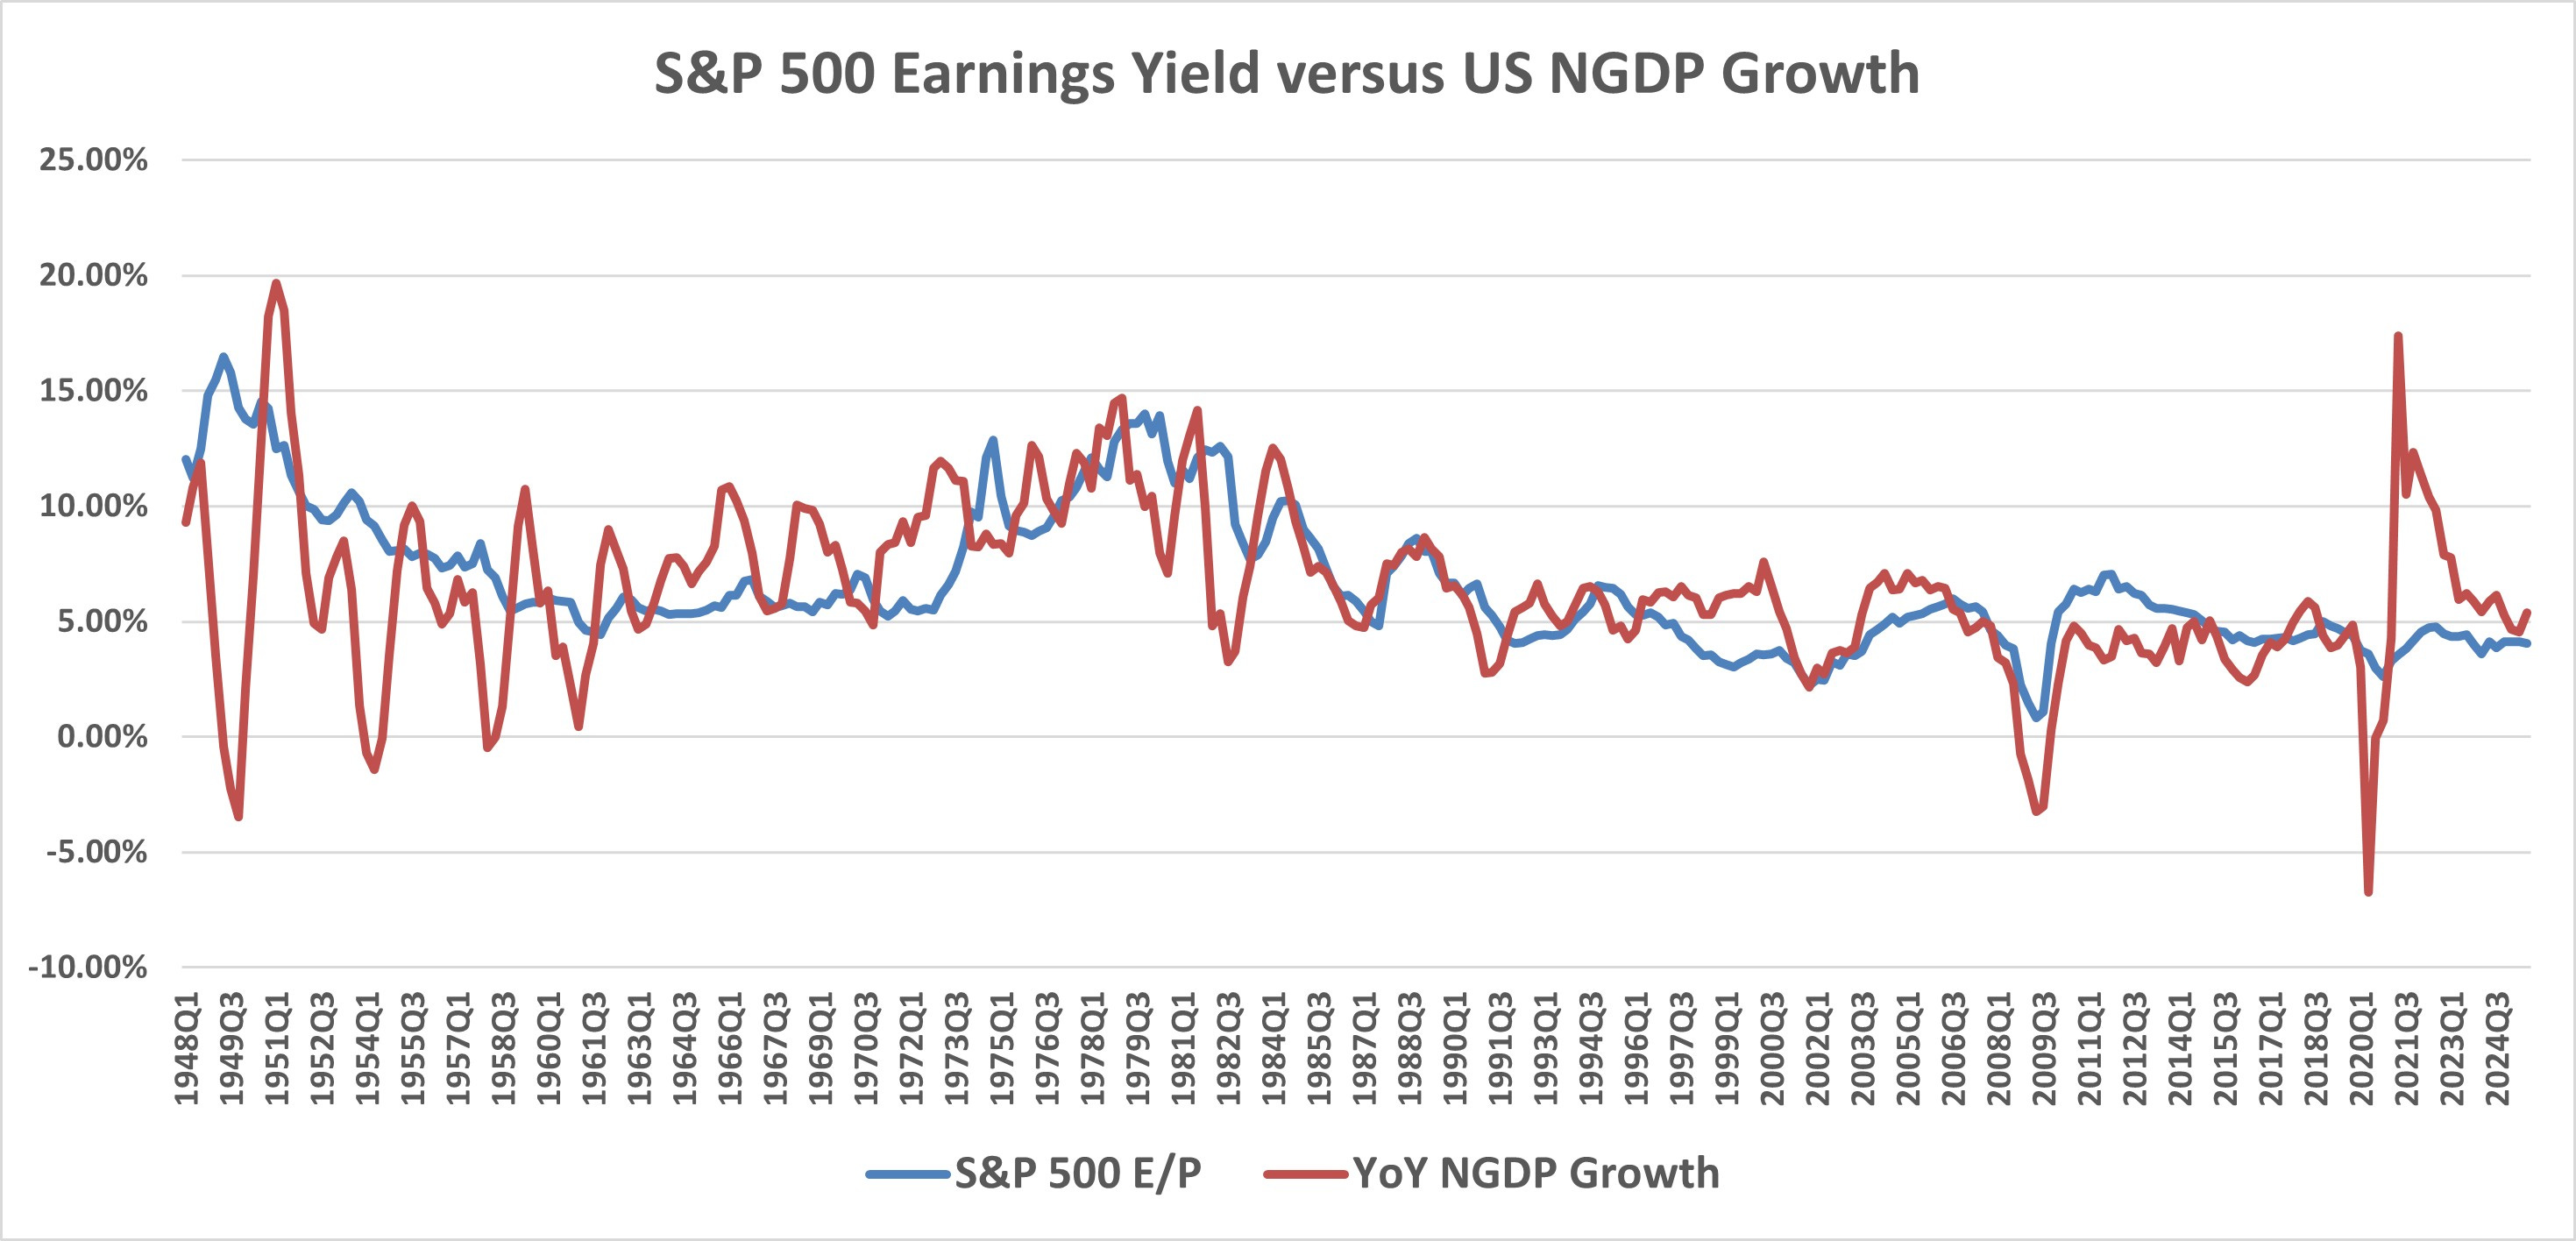
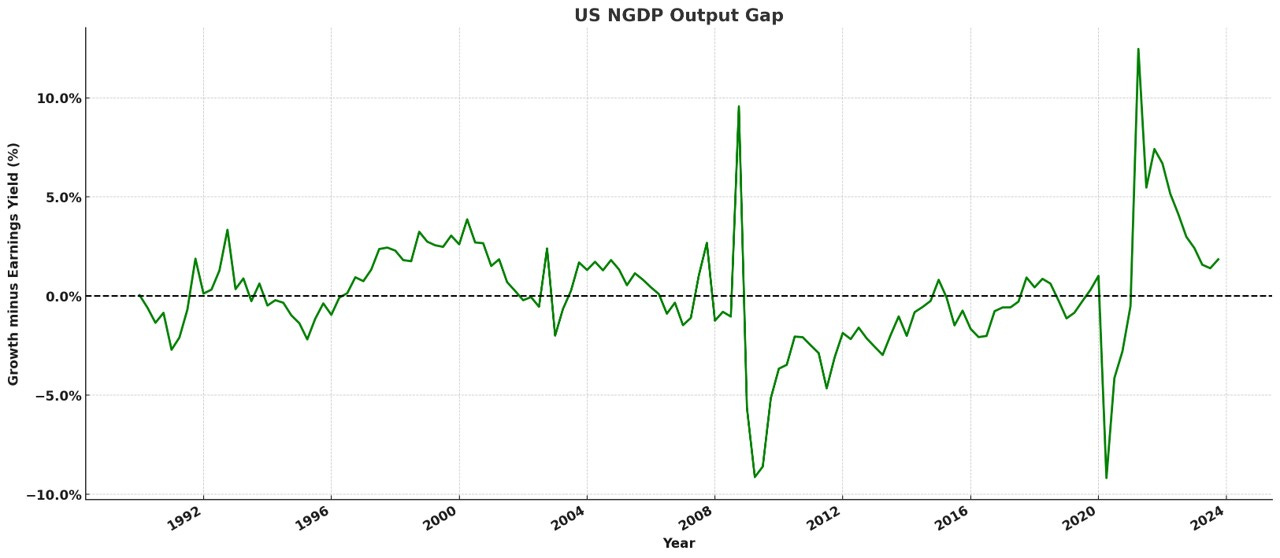
The strategic signal comes from the expected NGDP growth rate output gap, which is revealed in the spread between the S&P 500 earnings yield, using same quarter earnings, and the NGDP growth rate. This can employ reported, backward-looking data or forecasted earnings, stock price futures, and related NGDP forecasts for forward-looking signals.
This output gap is a good indicator, because there is an equilibrium relationship between the S&P 500 earnings yield and the NGDP growth rate. This reflects the classical economic principle that the rate of return on capital should equal the economic growth rate, in equilibrium. In fact, since 1948, the mean difference between these two metrics is only 0.24%, and is similarly low over many shorter stretches. (Data from Shiller and FRED)
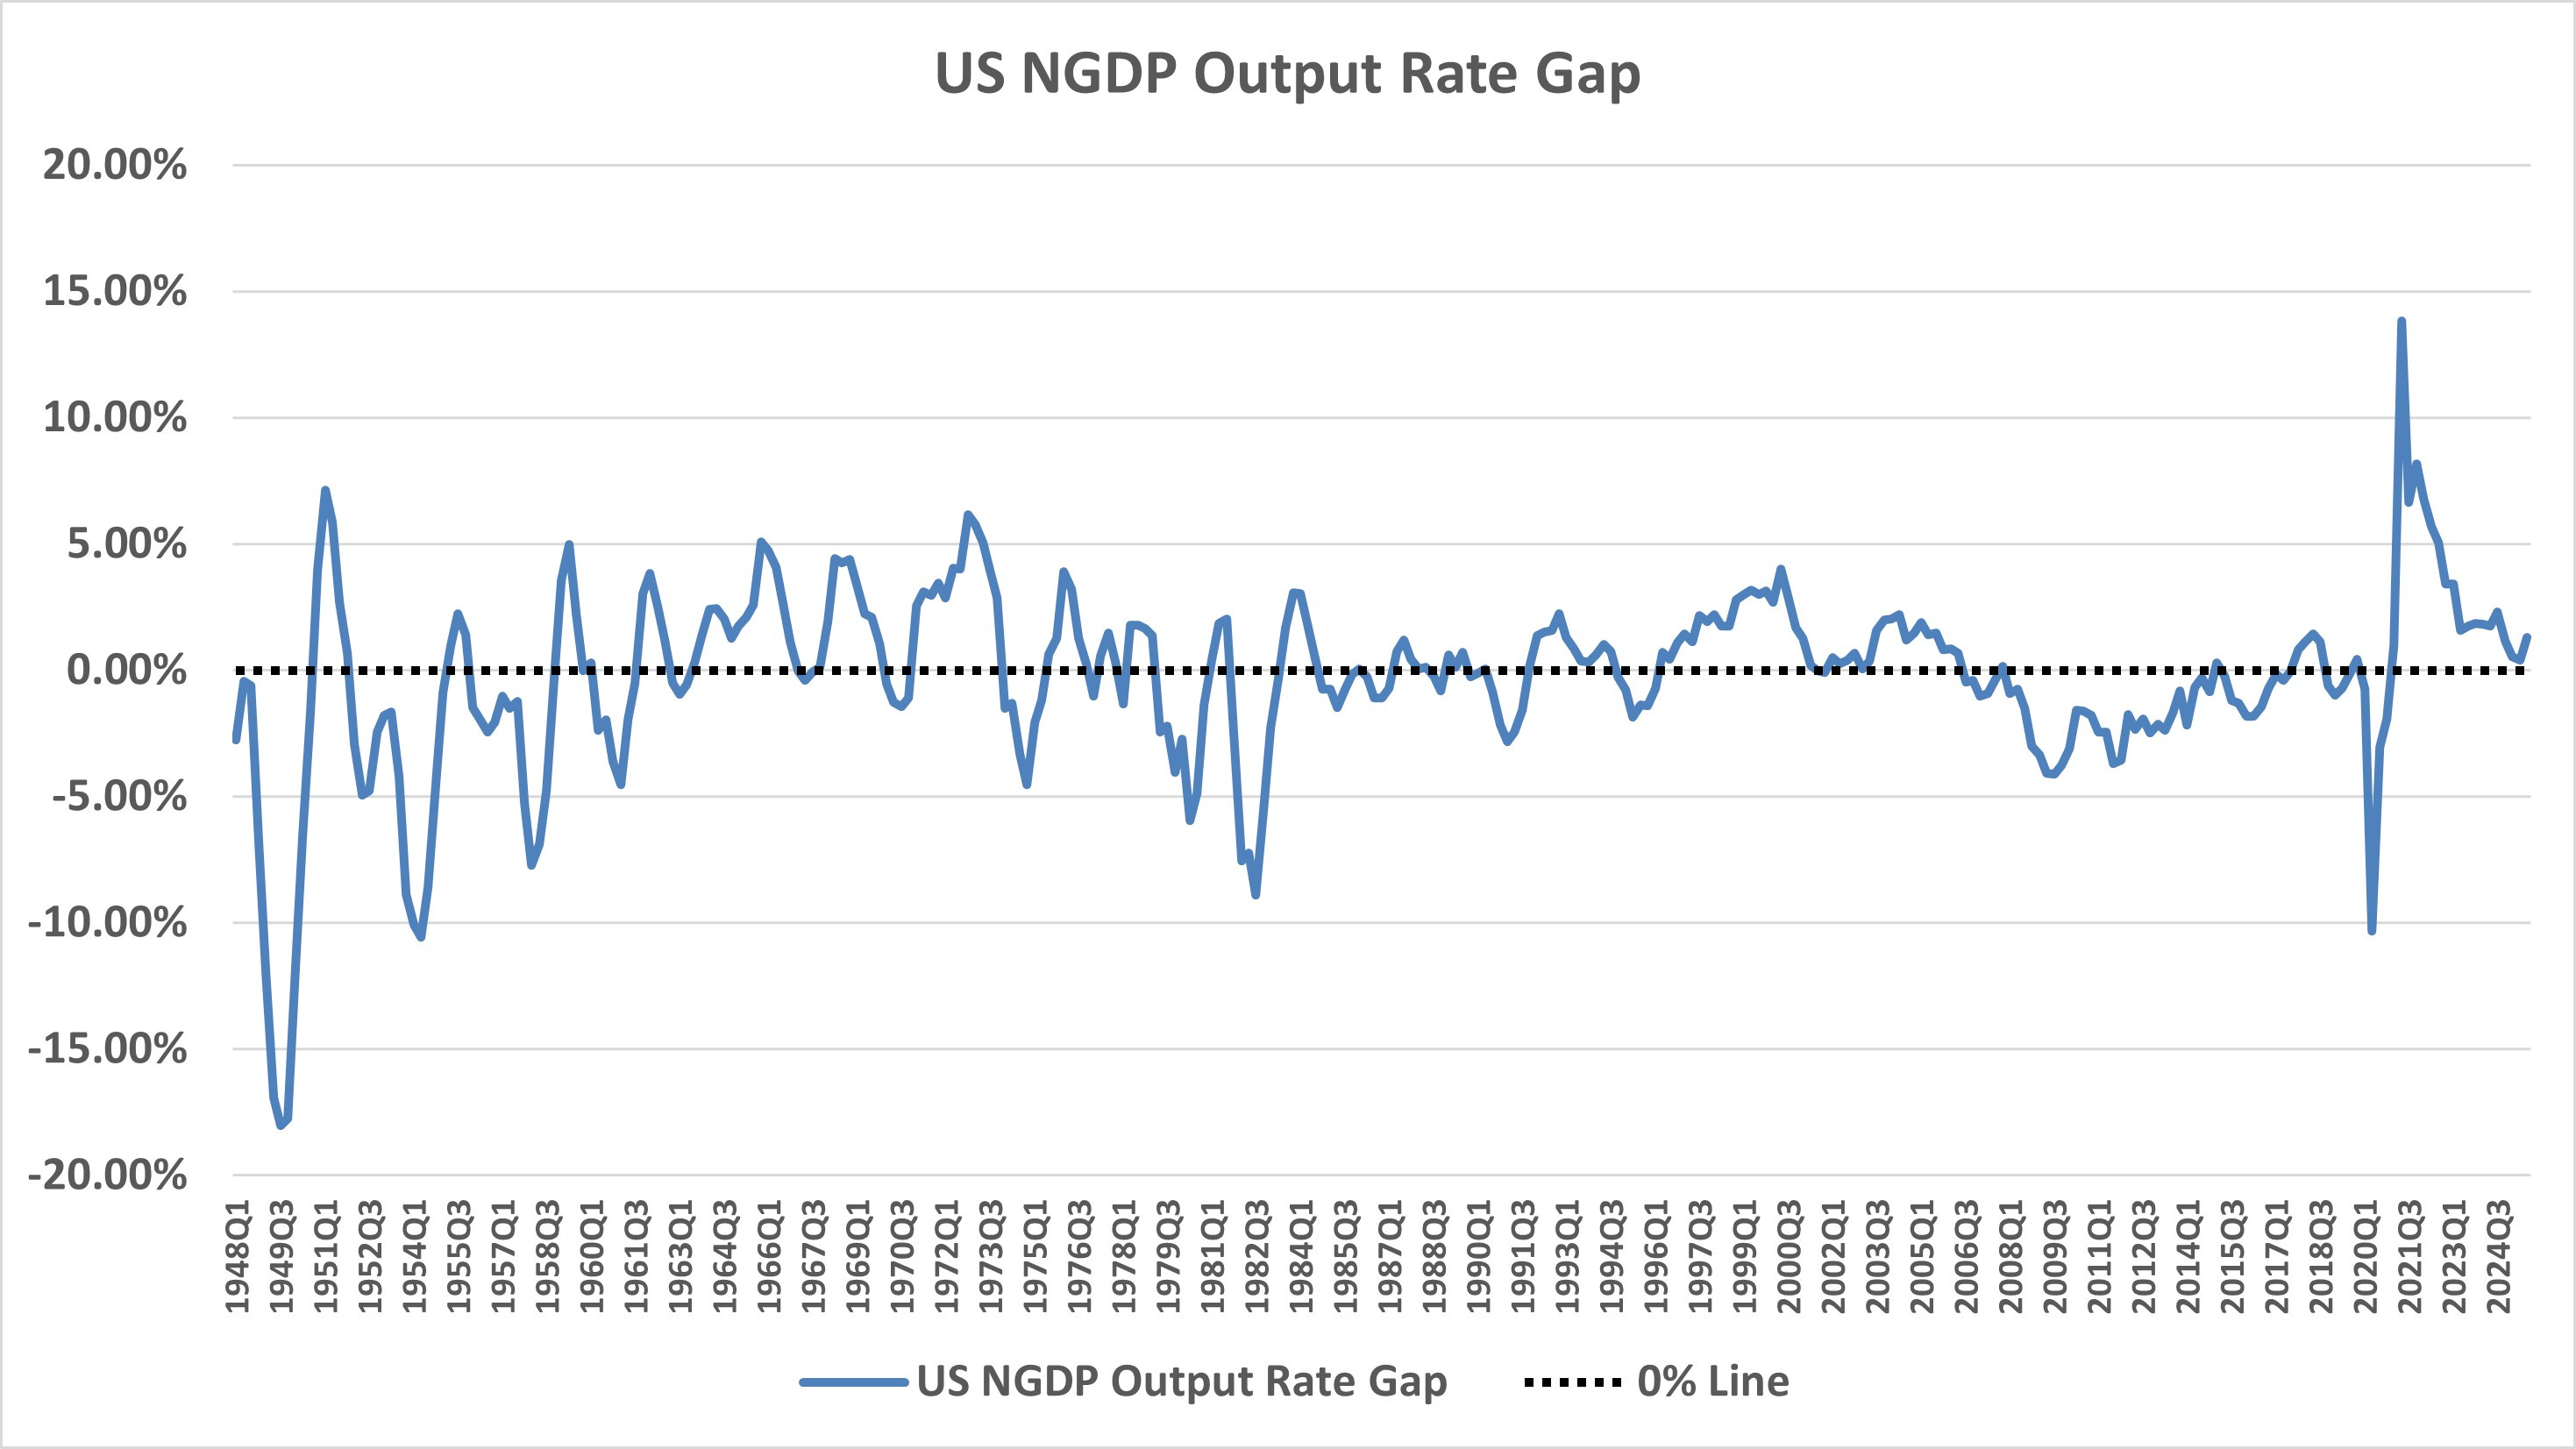
Looking at the bottom chart, that for the US NGDP Output Rate Gap, you can see that periods of hyper- or hypo-stimulation last roughly 4-to-5 years at most. This provides a pretty good estimate of how long such periods can last before wage adjustments cause changes in inflation to which the Fed responds to defend its inflation target. Note the period of hyper-stimulation during the dot-com boom and hypo-stimulation during the Great Recession and slow recovery, along with the extremes reached during the pandemic and its recovery. This metric provides a good guide for whether a “bubble” in stock prices exists and how long it can last.
Of course, the Fed can change its policy short of full wage and price adjustment cycles, and hence a tactical indicator is also useful. The best one I’ve found in recent years is the 5-Year/5-Year forward inflation expectation rate. It reveals market expectations for the average inflation rate for the the second 5-years of the next 10, ignoring the most immediate 5 years which can reflect temporary inflation changes due to supply shocks. It is based on TIPS spreads, which is the difference in yields between inflation protected and non-inflation protected Treasury bonds. Expect Fed action in some short time frame after this measure rises to or above about 2.35%, which is 2% in the Fed’s preferred core PCE terms.
These guides can obviously help investors avoid or hedge against the most extreme volatillity in stock prices, increasing profits.
Statistical Evidence Supporting the NGDP Output Gap Measure
To further evaluate the usefulness of the NGDP output gap measure, I conducted expanding-window out-of-sample backtests using historical quarterly data. This means that each forecast was generated using only the information that would actually have been available at the time, making the exercise more realistic than a simple in-sample regression fit.
The results provide encouraging support for the measure. First, the NGDP output gap showed meaningful predictive power for future S&P 500 performance, especially over medium- and longer-term horizons. In the cleaner return-based tests, the out-of-sample R^2 values were about 0.04 at 1 quarter, 0.16 at 4 quarters, 0.14 at 8 quarters, 0.15 at 16 quarters, and 0.21 at 20 quarters. The direction of the relationship was also consistent with the underlying theory. Higher output gap readings tended to be followed by weaker later stock market performance, while lower or negative gap readings tended to be followed by stronger later performance.
This relationship was also statistically significant. In simple predictive regressions of future S&P 500 log returns on the current output gap, the coefficient on the output gap was negative and statistically significant at every horizon tested. Using Newey-West adjusted standard errors to account for overlapping forecast horizons, the p-values were approximately 0.00001 at 1 quarter, 0.0000002 at 4 quarters, 0.00005 at 8 quarters, 0.0028 at 16 quarters, and 0.0008 at 20 quarters. These results indicate that the relationship is unlikely to be due to random chance alone.
A second set of tests examined future S&P 500 levels using both the current output gap and the current S&P 500 level. These results were also strong, with out-of-sample R^2 values of about 0.08 at 1 quarter, 0.29 at 4 quarters, 0.37 at 8 quarters, 0.51 at 16 quarters, and 0.58 at 20 quarters, relative to a naive random-walk benchmark. These results should be interpreted with some caution, however, because they are best understood as another way of modeling future price changes rather than as evidence that the output gap alone predicts nominal index levels. Even so, in these level-based regressions the coefficient on the output gap also remained statistically significant at every horizon tested.
I also tested whether the output gap predicts future NGDP growth itself. The results were again positive, though somewhat weaker than for the stock market. In direct forecasts of future YoY NGDP growth, the out-of-sample R^2 values were about 0.05 at 1 quarter, 0.26 at 4 quarters, 0.32 at 8 quarters, 0.29 at 16 quarters, and 0.25 at 20 quarters. In the cleaner change-based test, which examines the future change in YoY NGDP growth, the out-of-sample R^2 values were about 0.02 at 1 quarter, 0.08 at 4 quarters, 0.16 at 8 quarters, 0.09 at 16 quarters, and essentially zero at 20 quarters. Here too, the sign of the relationship was consistent with the theory, with higher current output gap readings tending to be followed by weaker later NGDP growth.
The statistical significance results for NGDP growth were also encouraging. In the cleaner change-based regressions, the coefficient on the output gap was negative and statistically significant at every horizon tested. Using Newey-West adjusted standard errors, the p-values were about 0.029 at 1 quarter, 0.000000002 at 4 quarters, effectively zero at 8 quarters, 0.0000002 at 16 quarters, and 0.0010 at 20 quarters. In the direct future-NGDP-growth regressions that also included current NGDP growth, the output gap coefficient was statistically significant at 4 quarters and 8 quarters, but not at 1, 16, or 20 quarters. This is broadly consistent with the idea that the output gap is most useful for identifying medium-term macroeconomic reversion rather than very short-term fluctuations or very long-horizon point estimates.
Taken together, these findings strengthen the case that the NGDP output gap is not merely a descriptive measure of current macroeconomic conditions, but also a useful forward-looking indicator of both stock market sustainability and subsequent macroeconomic adjustment. The stock market results were stronger than the NGDP growth results, but both sets of evidence point in the same direction. This is consistent with the idea that the metric captures periods of monetary disequilibrium that tend to be followed by reversion toward a more sustainable path.

Since 1990, the evidence remains strongly supportive of the NGDP output gap measure, with especially impressive results for predicting future NGDP growth. In the S&P 500 backtests, the metric continued to show positive out-of-sample predictive power at medium and long horizons, with return-based out-of-sample R^2 values of about 0.07 at 4 quarters, 0.06 at 8 quarters, 0.19 at 16 quarters, and 0.28 at 20 quarters, though the 1-quarter result was slightly negative. The level-based S&P 500 results were also strong at longer horizons. More notably, the NGDP-growth results improved substantially in the post-1990 sample. In direct forecasts of future YoY NGDP growth, the out-of-sample R^2 values were about 0.05 at 1 quarter, 0.36 at 4 quarters, 0.52 at 8 quarters, 0.43 at 16 quarters, and 0.42 at 20 quarters. In the cleaner change-based tests, the corresponding values were about 0.06, 0.23, 0.35, 0.29, and 0.23. Taken together, these results suggest that, since 1990, the NGDP output gap has functioned even more convincingly as a medium-term indicator of macroeconomic disequilibrium and subsequent adjustment in both nominal growth and stock market performance.
Key Indicators:
Here, I outline key indicators that guide my understanding of economic growth and stock market signals. This guide explains the indicators I use, why they are important, and how they help interpret market forecasts and potential macroeconomic disequilibrium.
1. NGDP (Nominal Gross Domestic Product)
Indicator: NGDP measures the total value of goods and services produced in an economy without adjusting for inflation.
Why I Use It: NGDP is a comprehensive indicator of aggregate demand and economic activity. Stable NGDP growth indicates a healthy economy, while deviations can signal potential instability.
2. NGDP Output Rate Gap Measure
Indicator: The NGDP output gap measures the difference between actual NGDP and sustainable NGDP. (See below for more information.) Real GDP growth potential can oviously be derived from this measure.
Why I Use It: This measure helps identify whether the economy is operating above or below its sustainable level. A positive output gap indicates overheating, while a negative gap suggests underperformance, guiding policy decisions and market forecasts.
Future updates to this measure will only be available to paid subscribers, who will have access to the premium chatbot.
Note: Scroll down to the appendix at the bottom to read more about this indicator.
3. Treasury Yields, Earnings Yields, and the NGDP Growth Anchor
1. The Core Hypothesis
In equilibrium, financial yields should converge toward nominal growth. Classical and neoclassical economics already anticipated this:
Smith and Ricardo saw that returns on capital cannot drift far from national income growth.
Von Neumann formalized balanced growth paths where capital returns equal output growth.
Ramsey tied intertemporal returns to sustainable consumption growth.
In nominal terms, this implies that Treasury yields and the S&P 500 earnings yield should, in equilibrium, align with NGDP growth.
2. The Cost-of-Carry Analogy
The equilibrium link can be clarified using the cost-of-carry model for stock index futures pricing.
In futures markets, the fair price of an index future equals the spot price adjusted for carry costs and benefits (e.g., interest rates, dividends, and financing spreads).
For an equity index like the S&P 500, this means:
F = S × exp[(r – d) × T]
where F is the futures price, S is the spot price, r is the risk-free rate, d is the dividend yield, and T is time to maturity.
The earnings yield acts as a proxy for the long-run return on capital embedded in the index.
If the cost-of-carry framework ensures arbitrage alignment between spot and futures prices, then in equilibrium the earnings yield must converge toward the nominal growth rate of the economy that sustains earnings growth.
The same logic extends to Treasuries:
Just as arbitrage enforces consistency in futures pricing, equilibrium conditions enforce consistency between bond yields and NGDP growth.
Treasuries embody the cost of financing over long horizons; if yields persistently diverged from nominal growth, it would imply arbitrage-like opportunities at the macro level (perpetual debt expansion or contraction inconsistent with stable growth).
3. Empirical Evidence
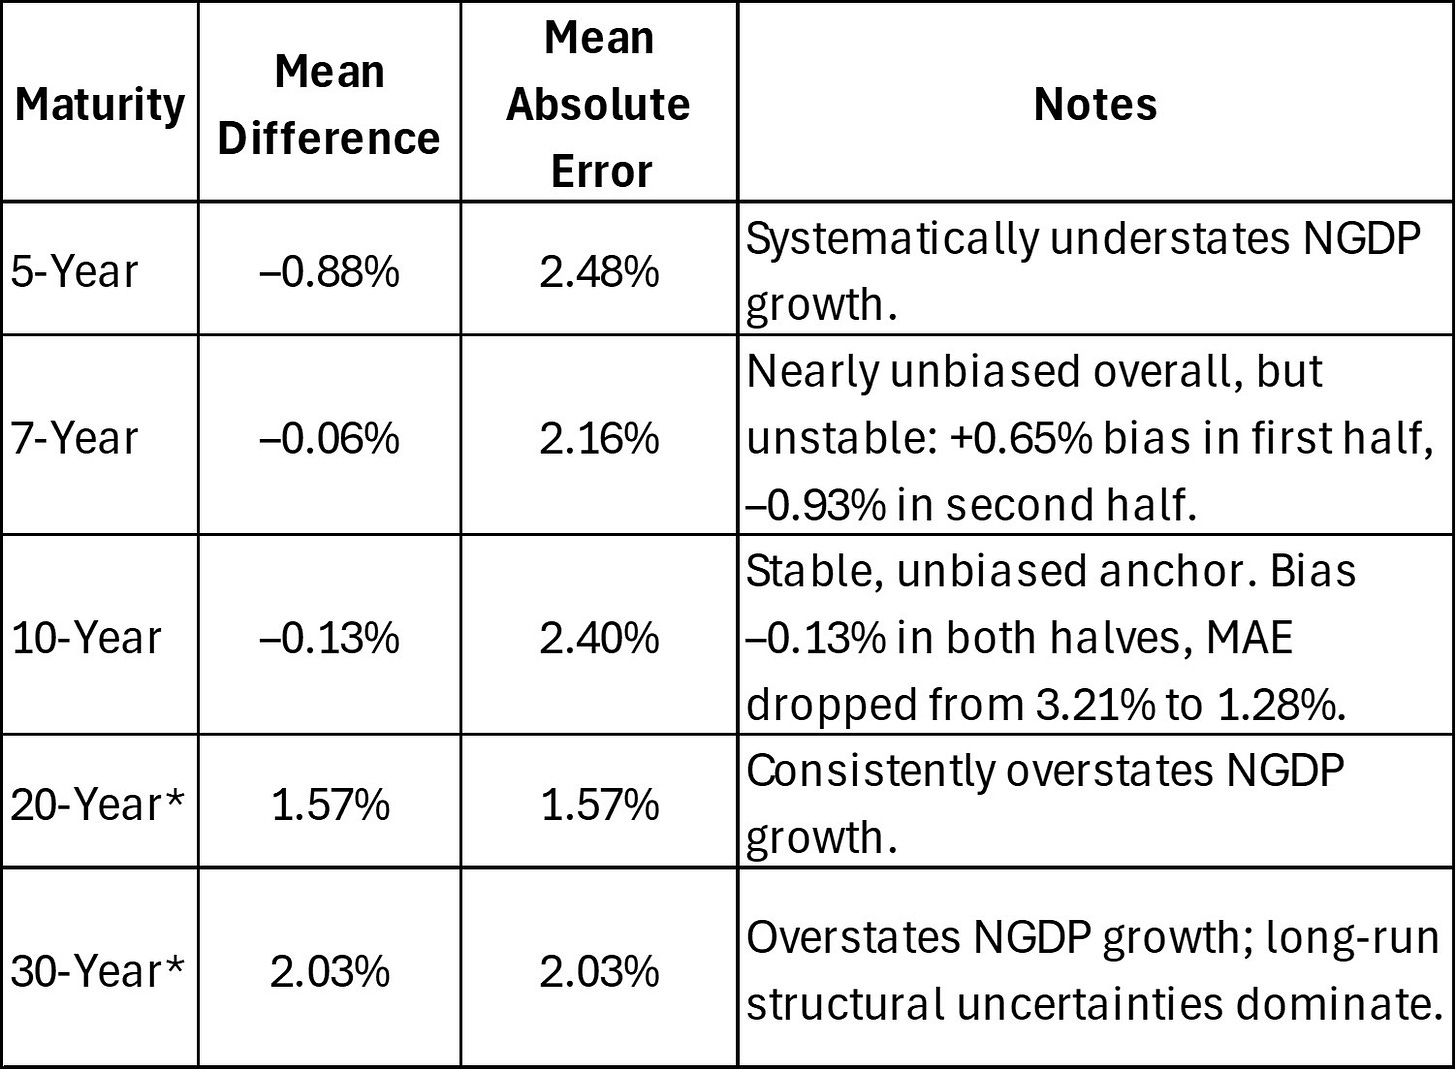
Long-Run (1960s–Present)
5Y Treasuries understate NGDP growth.
7Y Treasuries nearly unbiased but unstable over time.
10Y Treasuries consistently near-zero bias, improving precision in recent decades.
20–30Y Treasuries overstate growth, distorted by term premia and structural uncertainty.
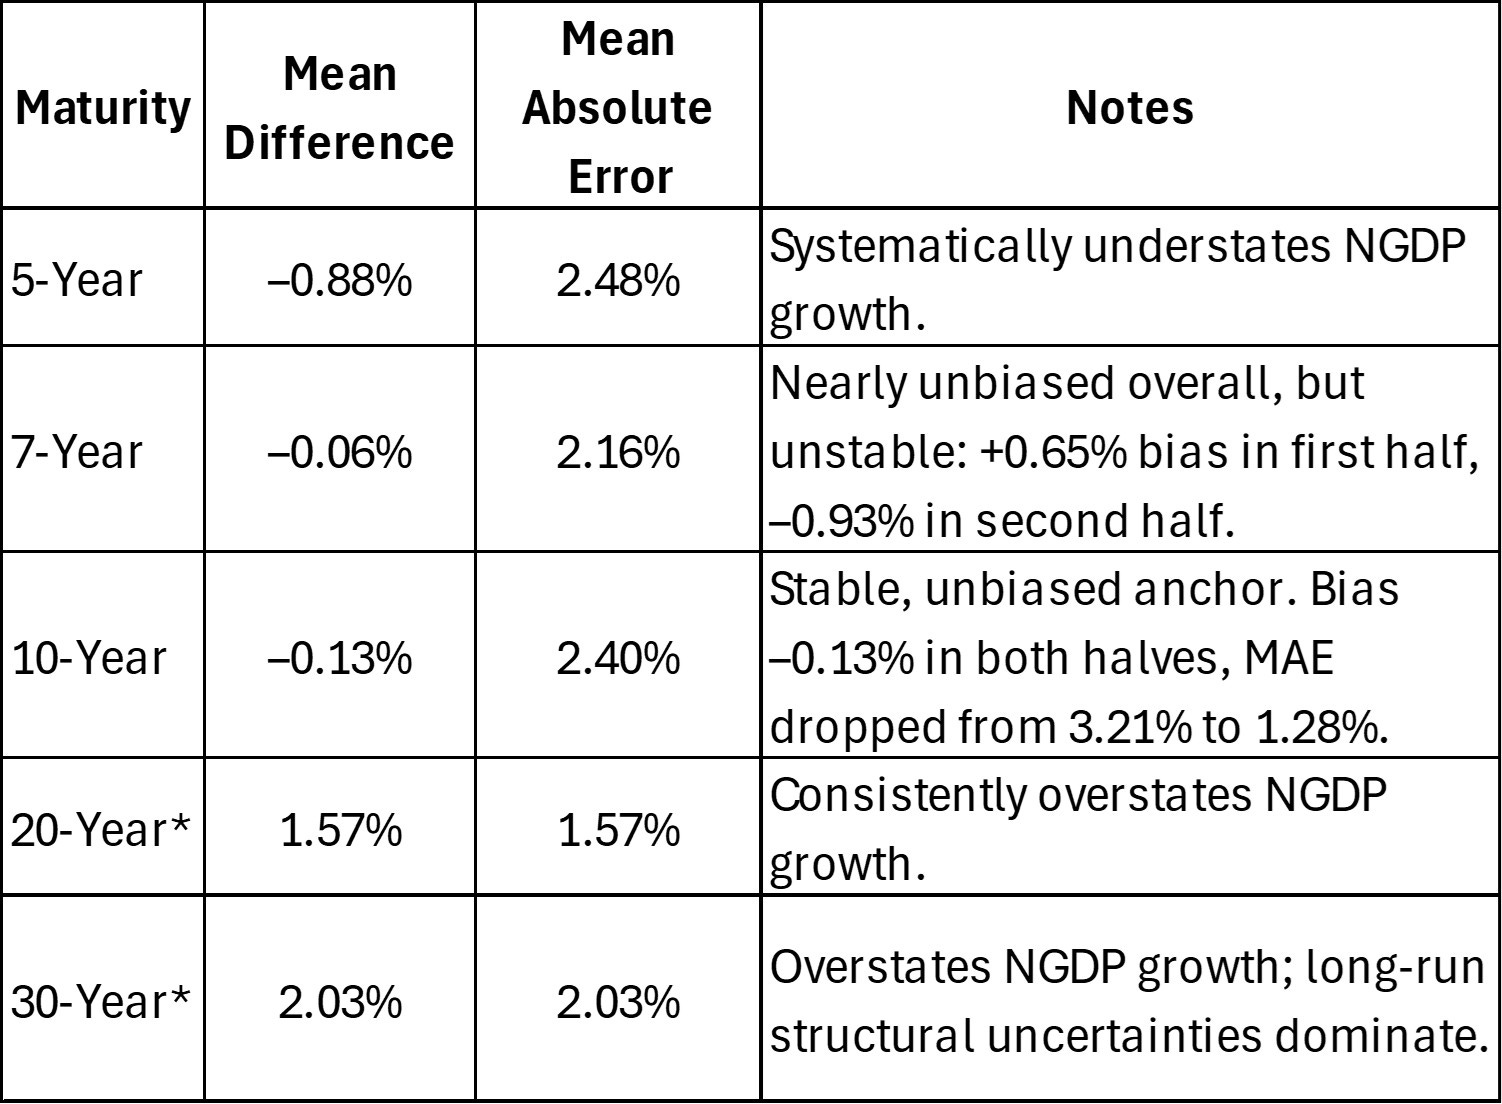
Modern Era (Since 1990)
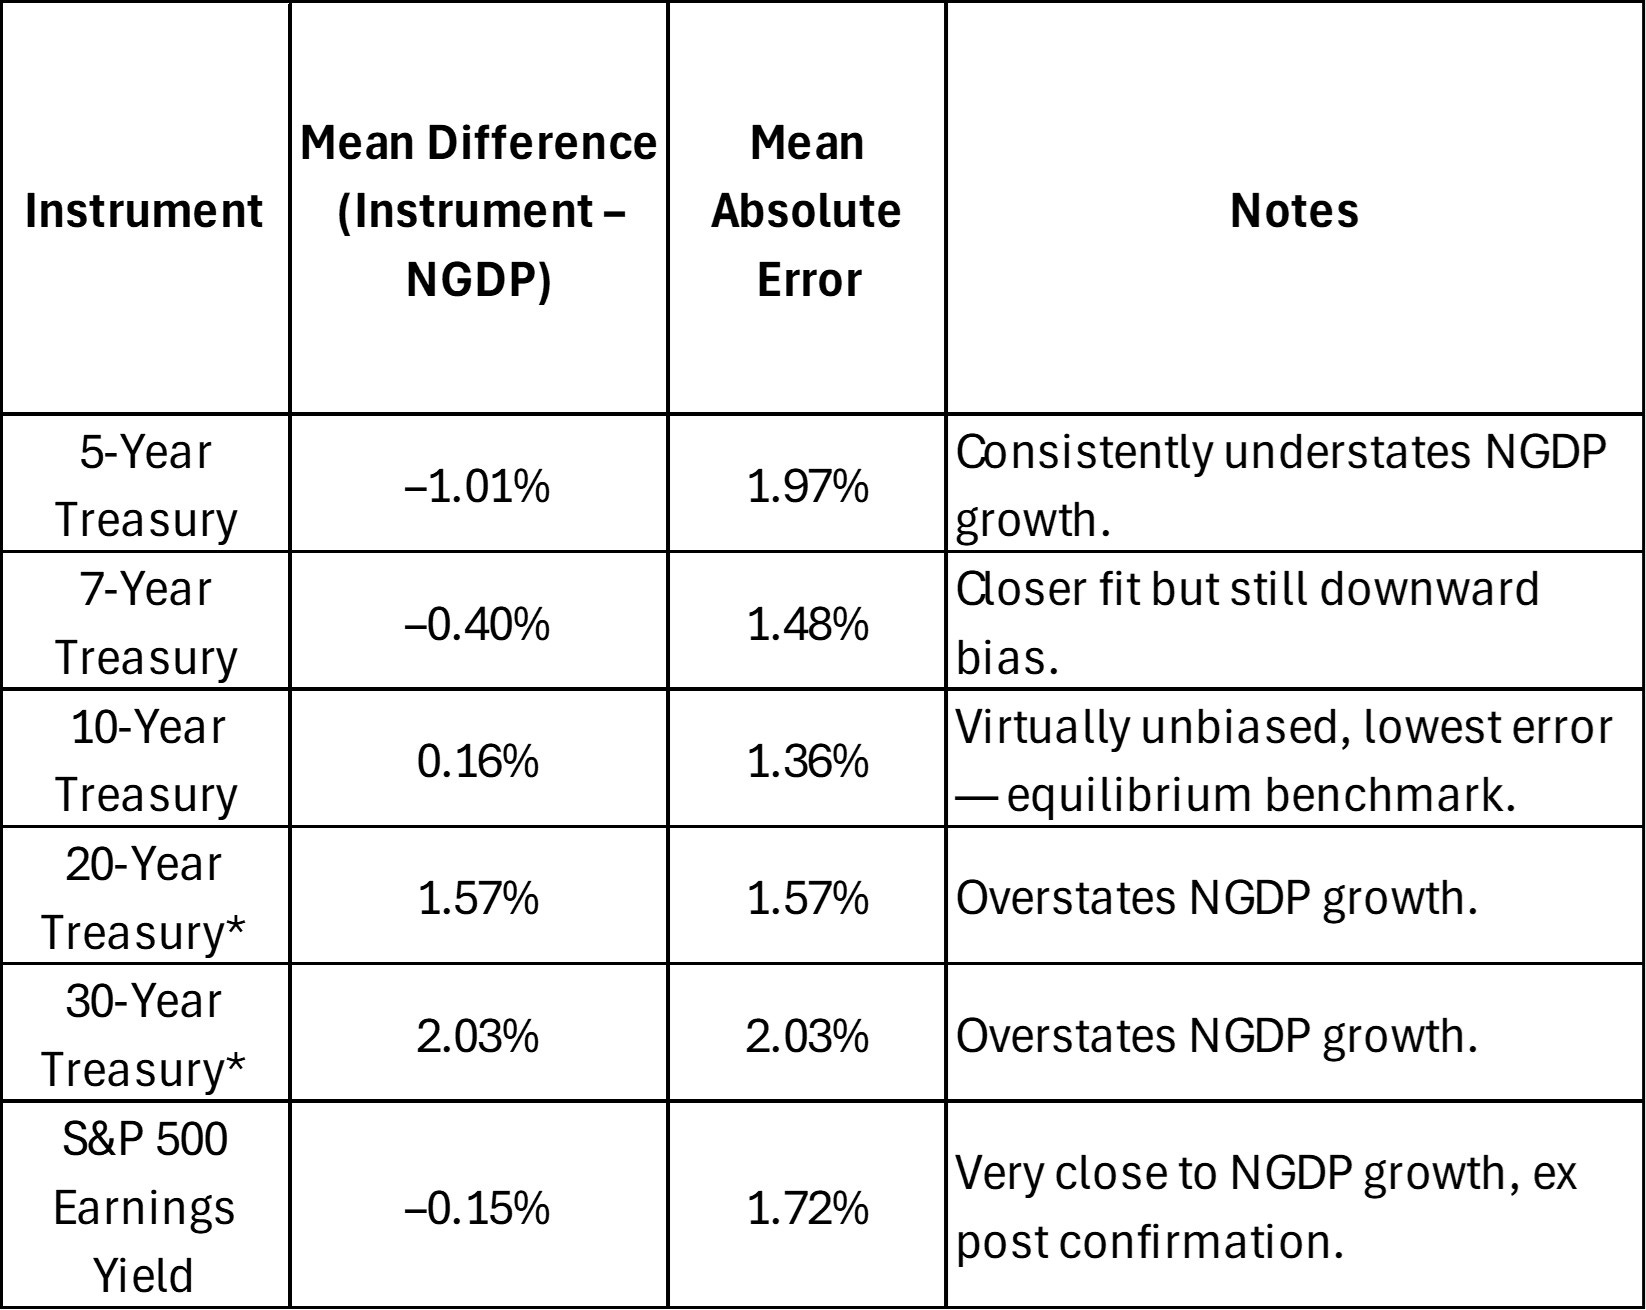
*For the 20 and 30-year yields, only the most recent unbroken data series were used.
Note: The S&P 500 earnings yield here uses same-quarter reported earnings, not trailing earnings.
4. Interpretation
The findings reinforce the equilibrium analogy:
The 10-Year Treasury yield functions like the fair financing rate implied in cost-of-carry models, as it is the market-clearing “carry rate” for the macroeconomy.
The S&P 500 earnings yield mirrors the equilibrium in equity space in that ex post, earnings converge to NGDP growth, just as dividend-adjusted carry ensures futures align with spot.
Deviations from these equilibrium anchors (e.g., at the 5Y or 30Y ends) reflect monetary instability, term premia, or structural uncertainty, not equilibrium mispricing.
5. Policy Implications
If monetary policy adopted NGDP level targeting, equilibrium consistency would be restored:
The Treasury curve would flatten at the NGDP growth target.
The 10Y would remain the forward anchor.
The S&P 500 earnings yield would serve as ex post confirmation, akin to a settlement check in futures markets.
6. Conclusion
The logic of the cost-of-carry model in equity markets provides a powerful analogy for understanding why Treasury yields and earnings yields gravitate toward NGDP growth in equilibrium.
Treasuries are the forward-looking anchor, enforcing financing consistency.
Equities provide the backward-looking confirmation, aligning returns with growth.
Together, they validate the classical insight: in a stable monetary regime, yields must converge to nominal growth.
4. Expected NGDP Metric
This section explains how a coherent, EMH-consistent framework links macro-financial variables of the late 1990s/early 2000s, characterized by booming real output, flat yield curves, high equity valuations with a novel “expected NGDP growth” metric.
The core idea
At the heart of the model is this equilibrium condition:
E/P = r = g
where
E/P is the aggregate earnings‐yield of the broad stock market (inverse of P/E)
r is the required return on capital (discount rate)
g is the long-run expected growth rate of the economy (nominal or real depending on context)
In other words, in a stable monetary and economic regime the market prices equity such that the return and growth expectations align, so no excess spread (r − g) accrues. Under this regime, the differential risk premium between equities and Treasuries shrinks because monetary‐/nominal‐policy risk is anchored.
Why this matters for asset valuations
If r and g both fall, but r falls by at least as much as g (Δr ≥ Δg), then the earnings yield E/P falls (i.e., P/E rises), and aggregate market valuation (market cap/GDP) rises. That explains how valuations can rise even as growth prospects may be structurally moderating. This answers four puzzles simultaneously:
Booming RGDP/TFP: A short‐run productivity/investment boom (for instance in IT in the late 1990s) temporarily boosted g in the short run, even while the long‐run structural growth ceiling was being revised downward.
Flat long‐term yield curves: Bond markets priced in the headwinds to long‐run growth (lower g) and anchored inflation expectations, so nominal yields didn’t rise dramatically despite the boom.
Low S&P earnings yield / high P/E ratios: With r falling (due to lower inflation expectations, lower risk‐free rates, global savings supply) and g not rising by the same magnitude, the spread r − g narrowed, which rationally justifies higher valuations.
High market cap/GDP ratio: Since the discount rate has fallen, future expected cash-flows are worth more today, which increases the ratio of equity market value to current GDP.
How the thesis explains the dot-com period anomaly
One of the seemingly strange phenomena of the late 1990s was falling nominal growth expectations even while real economy and productivity were booming. Under this model this makes sense:
The productivity/IT investment boom drove short-run real growth (and thereby boosted earnings), but the market recognised structural headwinds (slowing labour force growth, diminishing marginal returns to IT capital) that implied long‐run g would be lower.
Simultaneously the cost of capital r was falling (anchored inflation, global savings glut) so the market believed that r would decline by more than g. Hence the spread (r−g) shrank, justifying a fall in earnings yield and a rise in valuations.
Because the expected NGDP metric (average of earnings yield & 10y yield) captured the nominal income growth expectations of the market, its decline signals that while real growth expectations may have been elevated in the short run, the market was anticipating lower nominal growth in equilibrium, which is a sign of regime shift rather than irrational exuberance.
Role of monetary policy – NGDP level targeting
In this view the key condition enabling r ≈ g (and thus E/P ≈ r ≈ g) is a stable monetary/nominal‐income regime. NGDP Level Targeting (NGDPLT) could be such a regime in the US. Under NGDPLT the central bank commits to a path of nominal income (rather than simply inflation or output gap), anchoring expectations, reducing policy risk and therefore compressing risk premia. Empirical literature finds NGDPLT reduces volatility in real output and nominal growth relative to more discretionary regimes. See this reference: LSU+2Mercatus Center+2. Hence under NGDPLT there is a deeper compression of r and risk premia, bringing the economy closer to the equilibrium reflected in E/P = r = g.
Practical implications
When you see this expected NGDP metric declining while valuations are rising, interpreting it within this thesis suggests that the market is pricing a regime of lower cost of capital and anchored policy rather than simply exuberance.
If the spread between earnings yield and Treasury yield narrows, one might infer risk premia are compressing, possibly due to increased stability in nominal policy or global savings dynamics.
Conversely, if policy credibility weakens (for example a sharp inflation surprise, regime shift, big policy error), then risk premia widen, r rises, and valuations come under pressure, consistent with the proposed dot-com crash mechanism.
Monitoring this metric gives an early signal of the market’s implied nominal income growth expectations. If the metric falls but valuations stay high, one might ask whether the assumption that r will fall (or risk premia compress) is still viable.
Caveats and boundary conditions
The transition from discretionary inflation-targeting regimes to true NGDPLT is untested in full scale; credibility and communication matter.
Structural shocks (technological, demographic, supply) still affect g; the model assumes markets rationally anticipate and price them, but forecasting errors occur. All market forecasts are conditional.
As EMH predicts, this expected NGDP growth metric offers no forecasting advantage over simply autoregression.
Conclusion
This new expected NGDP metric, offers a parsimonious yet powerful lens for understanding why, in the late 1990s, asset valuations soared even while nominal growth expectations fell. Rather than chasing narratives of irrational mania, the model suggests that the market was anticipating a permanently lower cost of capital (r) under a more stable nominal-income regime, which more than offset structural growth headwinds (g). This framing turns valuation puzzles into logical consequences of regime shifts, risk premium compression, and intertemporal adjustment in the r–g spread.
5. 5-Year Inflation Breakeven Rate
Indicator: The 5-year inflation breakeven rate reflects market expectations of average inflation over the next five years.
Why I Use It: This rate provides insights into short-run inflation expectations. Short-run supply-side inflation should not result in a change in monetary policy, though historically it sometimes has, as was seen in 2008. An inflation targeting central bank should only adjust policy with regard to long-run inflation expctations. I translate this into core PCE terms, which means subtracting 35 basis points, to compare to the Fed’s mean 2% target.
6. 5-Year, 5-Year Forward Inflation Expectation Rate
Indicator: The 5-Year, 5-Year forward inflation expectation rate reflects market expectations of average inflation over last 5 of the next 10 years.
Why I Use It: This rate provides market expectations for longer run inflation that can appropriately inform the Fed about the need to adjust monetary policy to maintain it’s 2% inflation target in core PCE terms. To convert this figure from CPI terms to core PCE terms, subtract roughly 35 basis points. When this figure reaches or exceeds ~2.35% and persists, expect monetary policy to tighten in the near future.
7. Market-Based, Imputed NGDP Forecasts for Future Quarters
To estimate NGDP growth for future quarters, I use a method that combines analysts' earnings estimates with S&P 500 futures prices to calculate future expected S&P 500 concurrent quarter earnings yields. Here's how the process works:
Adjust Earnings Projections: I begin by adjusting the S&P 500 analyst earnings projections up by 6.7% to account for the typical underestimation bias observed in recent years.
Calculate Expected Earnings Yield: Using the adjusted earnings projections and S&P 500 futures prices, I calculate the expected S&P 500 concurrent quarter earnings yield. This approach ensures that I'm working with forward-looking data rather than relying on 12-month trailing earnings.
Estimate NGDP Growth: With the expected earnings yield in hand, I apply the following formula to estimate NGDP growth:
Expected NGDP Growth = Baseline NGDP Growth Rate + (Baseline NGDP Growth Rate - Expected S&P 500 Earnings Yield). The baseline is the mean NGDP growth rate since just before the Great Recession.
This formula adjusts the baseline NGDP growth estimate by accounting for the difference between the baseline and the expected S&P 500 earnings yield. The rationale is to capture the long-term equilibrium relationship between these variables.
Although these estimates are currently rough, this method provides valuable insights into expected economic growth, allowing for adjustments as market conditions and earnings forecasts evolve.
Future forecast releases will only be available to paid subscribers, who will have access to the premium chatbot.
8. Earnings versus Dividends
Indicator: Earnings represent a company's profits, while dividends are the portion of earnings distributed to shareholders.
Why I Use Earnings: Earnings are more directly tied to economic growth and NGDP. They provide a better measure of a company's performance and its relationship with overall economic conditions, making them more useful for analyzing economic health and stock market performance.
9. Commodity Prices (Oil Futures and CRB Index)
Indicator: Commodity prices, including oil futures and the Commodity Research Bureau (CRB) index, track the prices of raw materials and energy.
Why I Use Them: Commodity prices help differentiate between real and nominal shocks. Rising commodity prices can signal real economic changes, while stable prices with fluctuating NGDP may indicate nominal shocks, aiding in more accurate macroeconomic analysis. Historically, negative oil price shocks have often caused US recessions, or helped lead to Fed mistakes which caused them.
10. Wage/NGDP Ratio
Indicator: The wage/NGDP ratio compares total wages to NGDP, highlighting the share of economic output going to labor.
Why I Use It: Wage stickiness is a central issue in macroeconomic stability. A stable wage/NGDP ratio indicates balanced economic growth, while significant deviations can signal potential unemployment and lost output, highlighting macroeconomic disequilibrium.
11. Interest Rates and Monetary Policy Tools
Indicator: Interest rates are influenced by the Federal Reserve through open market operations (OMOs), interest on reserves (IOR), and reserve requirements.
Why I Use Them: Understanding how the Fed manipulates interest rates helps interpret the broader impacts of monetary policy on the economy. Interest rates serve as a signal of monetary conditions and their effect on economic growth, in the proper context.
12. Productivity Measures
Indicator: Productivity metrics assess the efficiency of production in the economy.
Why I Use Them: High productivity can enable the economy to grow above its long-term NGDP growth rate without triggering above-target inflation. Monitoring productivity helps identify periods of economic boom and their sustainability.
13. Mean Expected NGDP Growth Rate
Indicator: This is imputed from broad stock index data.
Why I Use It: Making the stock market forecast for economic growth explicit can help determine whether expected growth is sustainable, by comparing it to forecasted S&P 500 earnings yields, for example.
14. Historical Economic Patterns
Indicator: Historical data on economic recovery and growth trends.
Why I Use It: Historical patterns provide context for current economic conditions. The tendency of the US economy to return to equilibrium after significant nominal shocks within about five years helps predict recovery trajectories and policy effectiveness.
15. Public Communication of Policy Goals
Indicator: Clarity and comprehensibility of monetary policy goals to the public.
Why I Use It: Clear communication of policy goals, such as NGDP targeting, helps align public expectations with economic objectives, reducing uncertainty and promoting stable economic growth.
16. VIX (Volatility Index)
Indicator: The VIX measures the market's expectation of volatility over the next 30 days, often referred to as the "fear gauge."
Why I Use It: The VIX provides insights into market sentiment and risk perception. High VIX values indicate increased market uncertainty and potential economic instability, while low values suggest stability and confidence. Explicit translation of VIX levels into specific percent decline risks for the S&P 500, sectors, and individual stocks is available through a premium chatbot for paid subscribers.
17. S&P 500 Futures
Indicator: S&P 500 futures are contracts that speculate on the future value of the S&P 500 index.
Why I Use Them: S&P 500 futures reflect market expectations of future stock performance and economic conditions. Analyzing these futures helps gauge investor sentiment and forecast economic trends, particularly in response to news and policy changes.
18. Fed Fund Futures
Indicator: Fed Fund Futures are contracts that speculate on the future direction of the Federal Reserve's federal funds rate.
Why I Use Them: Fed Fund Futures provide insights into market expectations of future monetary policy actions. They are crucial for understanding how investors anticipate changes in interest rates, which can impact economic growth, inflation, and investment decisions.
19. NGDP-S&P 500 Growth Path Gap
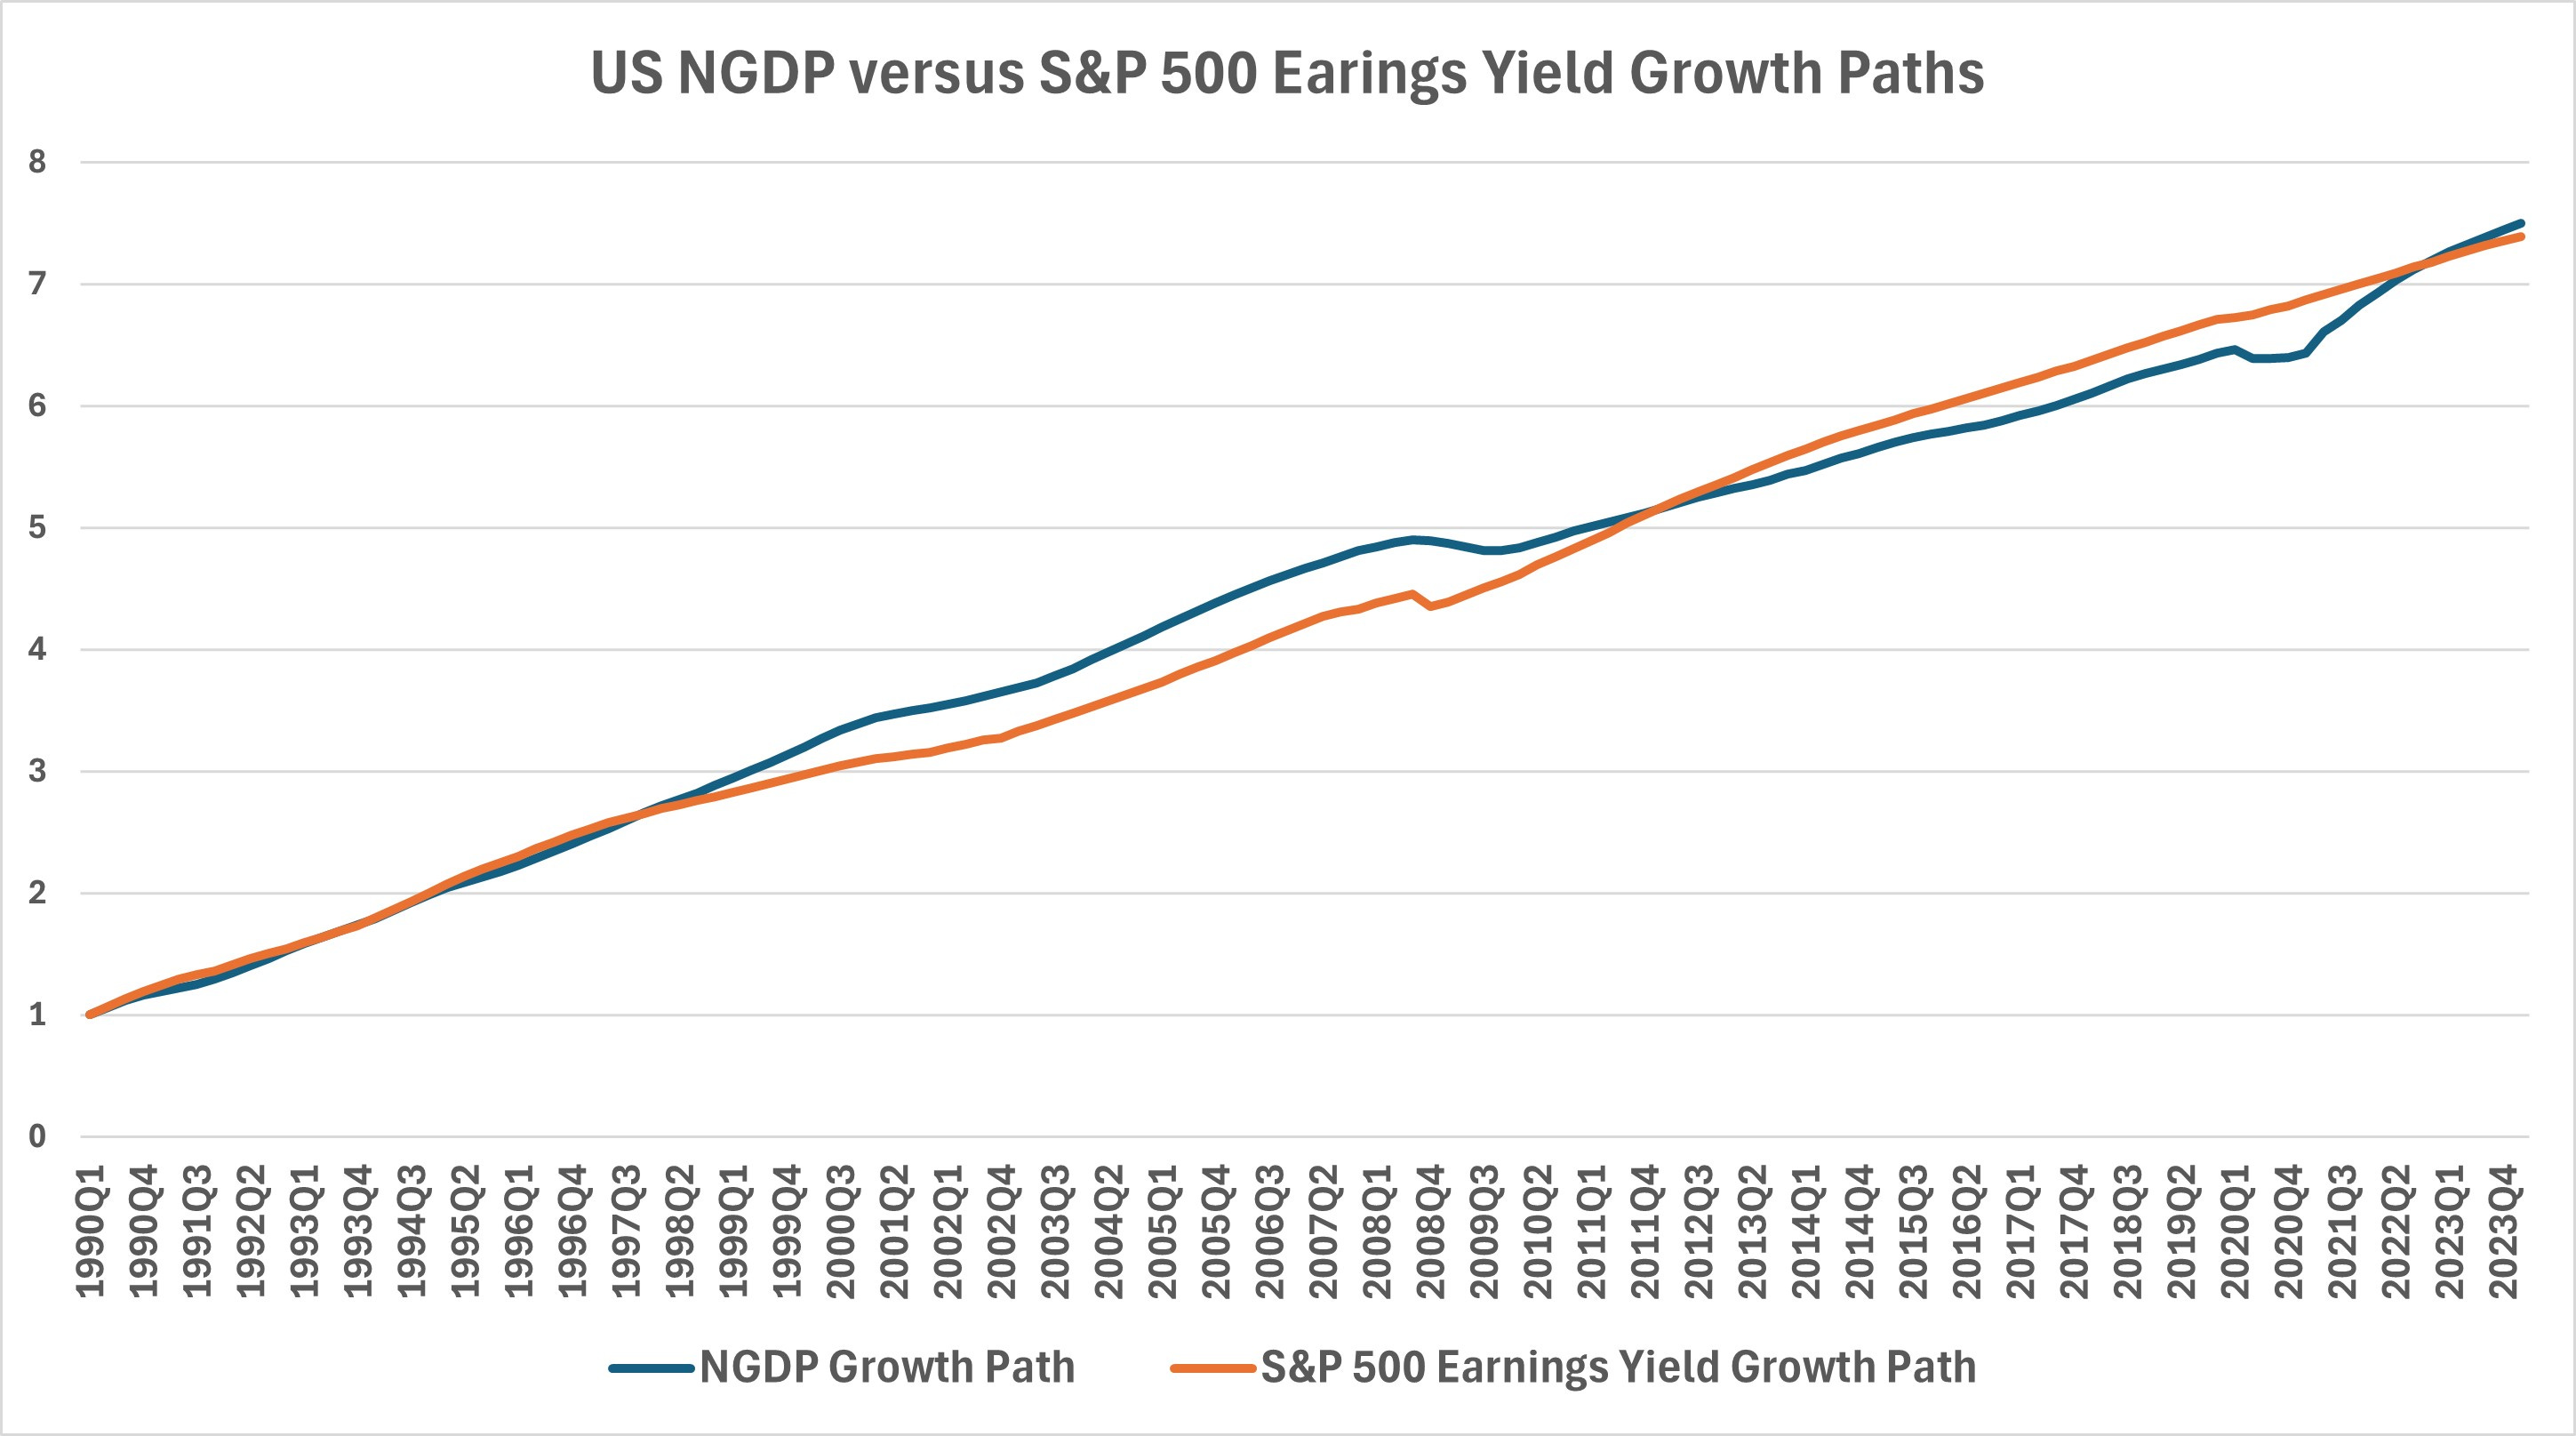
This level approach to looking at the relationship between NGDP growth and the S&P 500 concurrent quarter earnings yield offers more comprehensive estimates of sustainable growth than the rate-based NGDP output rate gap measure. This is based on the equilibrium relationship between the NGDP growth rate and the S&P 500 earnings yield, which in turn is based on the classical economic principle that the NGDP growth rate and the rate of return on capital have such a relationship.
This adds important nuance to debates over growth potential, as quarterly rate comparisons, while informative, do not represent the broader picture. When the NGDP growth path is above that of the S&P 500 earnings yield, it indicates an economic growth rate that’s above potential. If NGDP growth path is below that of the S&P 500 earnings yield, the economic growth rate is below potential.
Future updates to this data will only be available to paid subscribers, who will have access to the premium chatbot.
Appendix
Understanding the NGDP Output Gap: A Market-Driven Approach
Introduction: In the dynamic interplay of economic growth and market returns, the NGDP (Nominal Gross Domestic Product) output gap emerges as a pivotal measure, offering insights that traditional economic indicators may overlook. This unique approach, grounded in neoclassical economic theory, posits a theoretical equilibrium between NGDP growth rates and the rate of return on capital, as reflected in market measures like the S&P 500 earnings yield.
Theoretical Rationale: Neoclassical economics suggests that in an efficient market, the growth rate of the economy (measured by NGDP) and the rate of return on capital should converge towards an equilibrium. This relationship is predicated on the idea that capital flows into sectors and investments where it is most efficiently used, equating the return on investment with the overall economic growth rate. By examining the gap between NGDP growth and the S&P 500 earnings yield, this measure assesses the alignment or divergence from this theoretical equilibrium.
Definition and Importance: The NGDP output gap is defined as the difference between the actual quarterly growth rate of NGDP and the annualized earnings yield of the S&P 500 for the same quarter. This gap indicates whether the actual economic output is overperforming or underperforming relative to the returns expected by the market.
A critical aspect of this measure is its ability to provide a more integrated view of economic health, combining macroeconomic output with market expectations. It serves as an essential tool for investors and policymakers to gauge the underlying pressures in the economy that might not be apparent through traditional analysis.
Calculation Method:
Obtain NGDP Growth Rate: This is the percentage increase in NGDP, year-over-year, available from economic data sources like the Bureau of Economic Analysis (BEA).
Determine S&P 500 Earnings Yield: Calculate this by taking the inverse of the price-to-earnings ratio of the S&P 500, representing the expected rate of return on investments in the stock market.
Compute the Gap: The NGDP output gap is then calculated as NGDP growth rate minus the S&P 500 earnings yield. A positive gap suggests that the economy is growing faster than market returns would suggest, potentially signaling overheating. Conversely, a negative gap indicates underperformance, which might call for stimulative economic policies.
Implications:
Positive NGDP Output Gap: May indicate potential inflationary pressures, suggesting that the economy might be running hotter than what would be ideal based on market returns.
Negative NGDP Output Gap: Suggests that there is slack in the economy, potentially warranting measures to stimulate growth and align NGDP growth with market expectations.
Historical Application: Using this measure in periods of economic uncertainty or transition can reveal significant insights. For instance, during the recovery from the 2008 financial crisis or in the recent volatile economic climate influenced by global events, the NGDP output gap can highlight discrepancies between economic output and market expectations, guiding more nuanced policy responses.
This market-driven approach to analyzing economic performance through the NGDP output gap provides a comprehensive perspective that aligns macroeconomic indicators with financial market dynamics, offering a robust framework for economic analysis and decision-making.
Justifying Use of the S&P 500 Index as a Proxy for the Broad Rate of Return on Capital
Market Coverage and Capital Representation: The S&P 500 index includes 500 of the largest companies listed on stock exchanges in the United States, covering about 80% of the available market capitalization. This broad coverage makes it a representative sample of the overall market and a reasonable proxy for the economic activity generated by large capital investments across diverse sectors. Additionally, because these companies are generally among the largest and their markets are often saturated, they predominantly depend on NGDP growth for earnings growth. This dependence makes the S&P 500 earnings yield particularly reflective of the broader economic conditions, reinforcing its role as a proxy for the rate of return on capital.
Earnings Yield as a Return Indicator: The earnings yield (inverse of the price-to-earnings ratio) of the S&P 500 is a direct measure of the income (earnings) generated per unit of price (investment). It serves as an indicator of the profitability of companies from an investor's perspective, approximating the return on capital that investors expect from the market. Higher earnings yields suggest higher returns relative to the prices paid for stocks, reflecting investor expectations about future profitability.
Liquidity and Market Efficiency: The S&P 500 is highly liquid, meaning it is frequently traded, which ensures that its price reflects up-to-date information about the underlying companies and the overall economy. This efficiency supports the argument that the earnings yield can be a timely and effective proxy for the return on capital, as it embodies the collective market sentiment and expectations about future economic conditions.
Economic Influence and Sentiment: The companies in the S&P 500 are not just large in terms of capitalization; they also wield considerable influence over the economy. Their performance can impact economic policy and investor sentiment broadly, making their aggregated earnings yield a significant indicator of economic trends.
Historical Correlation with Economic Cycles: Historical data often shows a correlation between the performance of the S&P 500 and broader economic cycles. During periods of economic growth, the earnings yield may decrease as stock prices rise on optimism and expected future earnings growth, reflecting the decreased cost of capital. Conversely, during economic downturns, the earnings yield might increase as prices fall, indicating higher returns on lower-priced stocks and a more cautious economic outlook.
Comparative Analysis: By comparing the NGDP growth rate with the S&P 500 earnings yield, you can assess whether the real economy is growing at a pace justified by the returns expected by the capital markets. This can provide insight into whether current market valuations are supported by economic fundamentals or if discrepancies might indicate an overheating or under-stimulation of the economy.
These points collectively justify the use of the S&P 500 earnings yield as a proxy for the rate of return on capital, making it a useful tool in economic analysis to gauge the alignment or misalignment of market valuations with actual economic performance.