
Stock and GDP Outlook, for Week Ending 11/21/2025
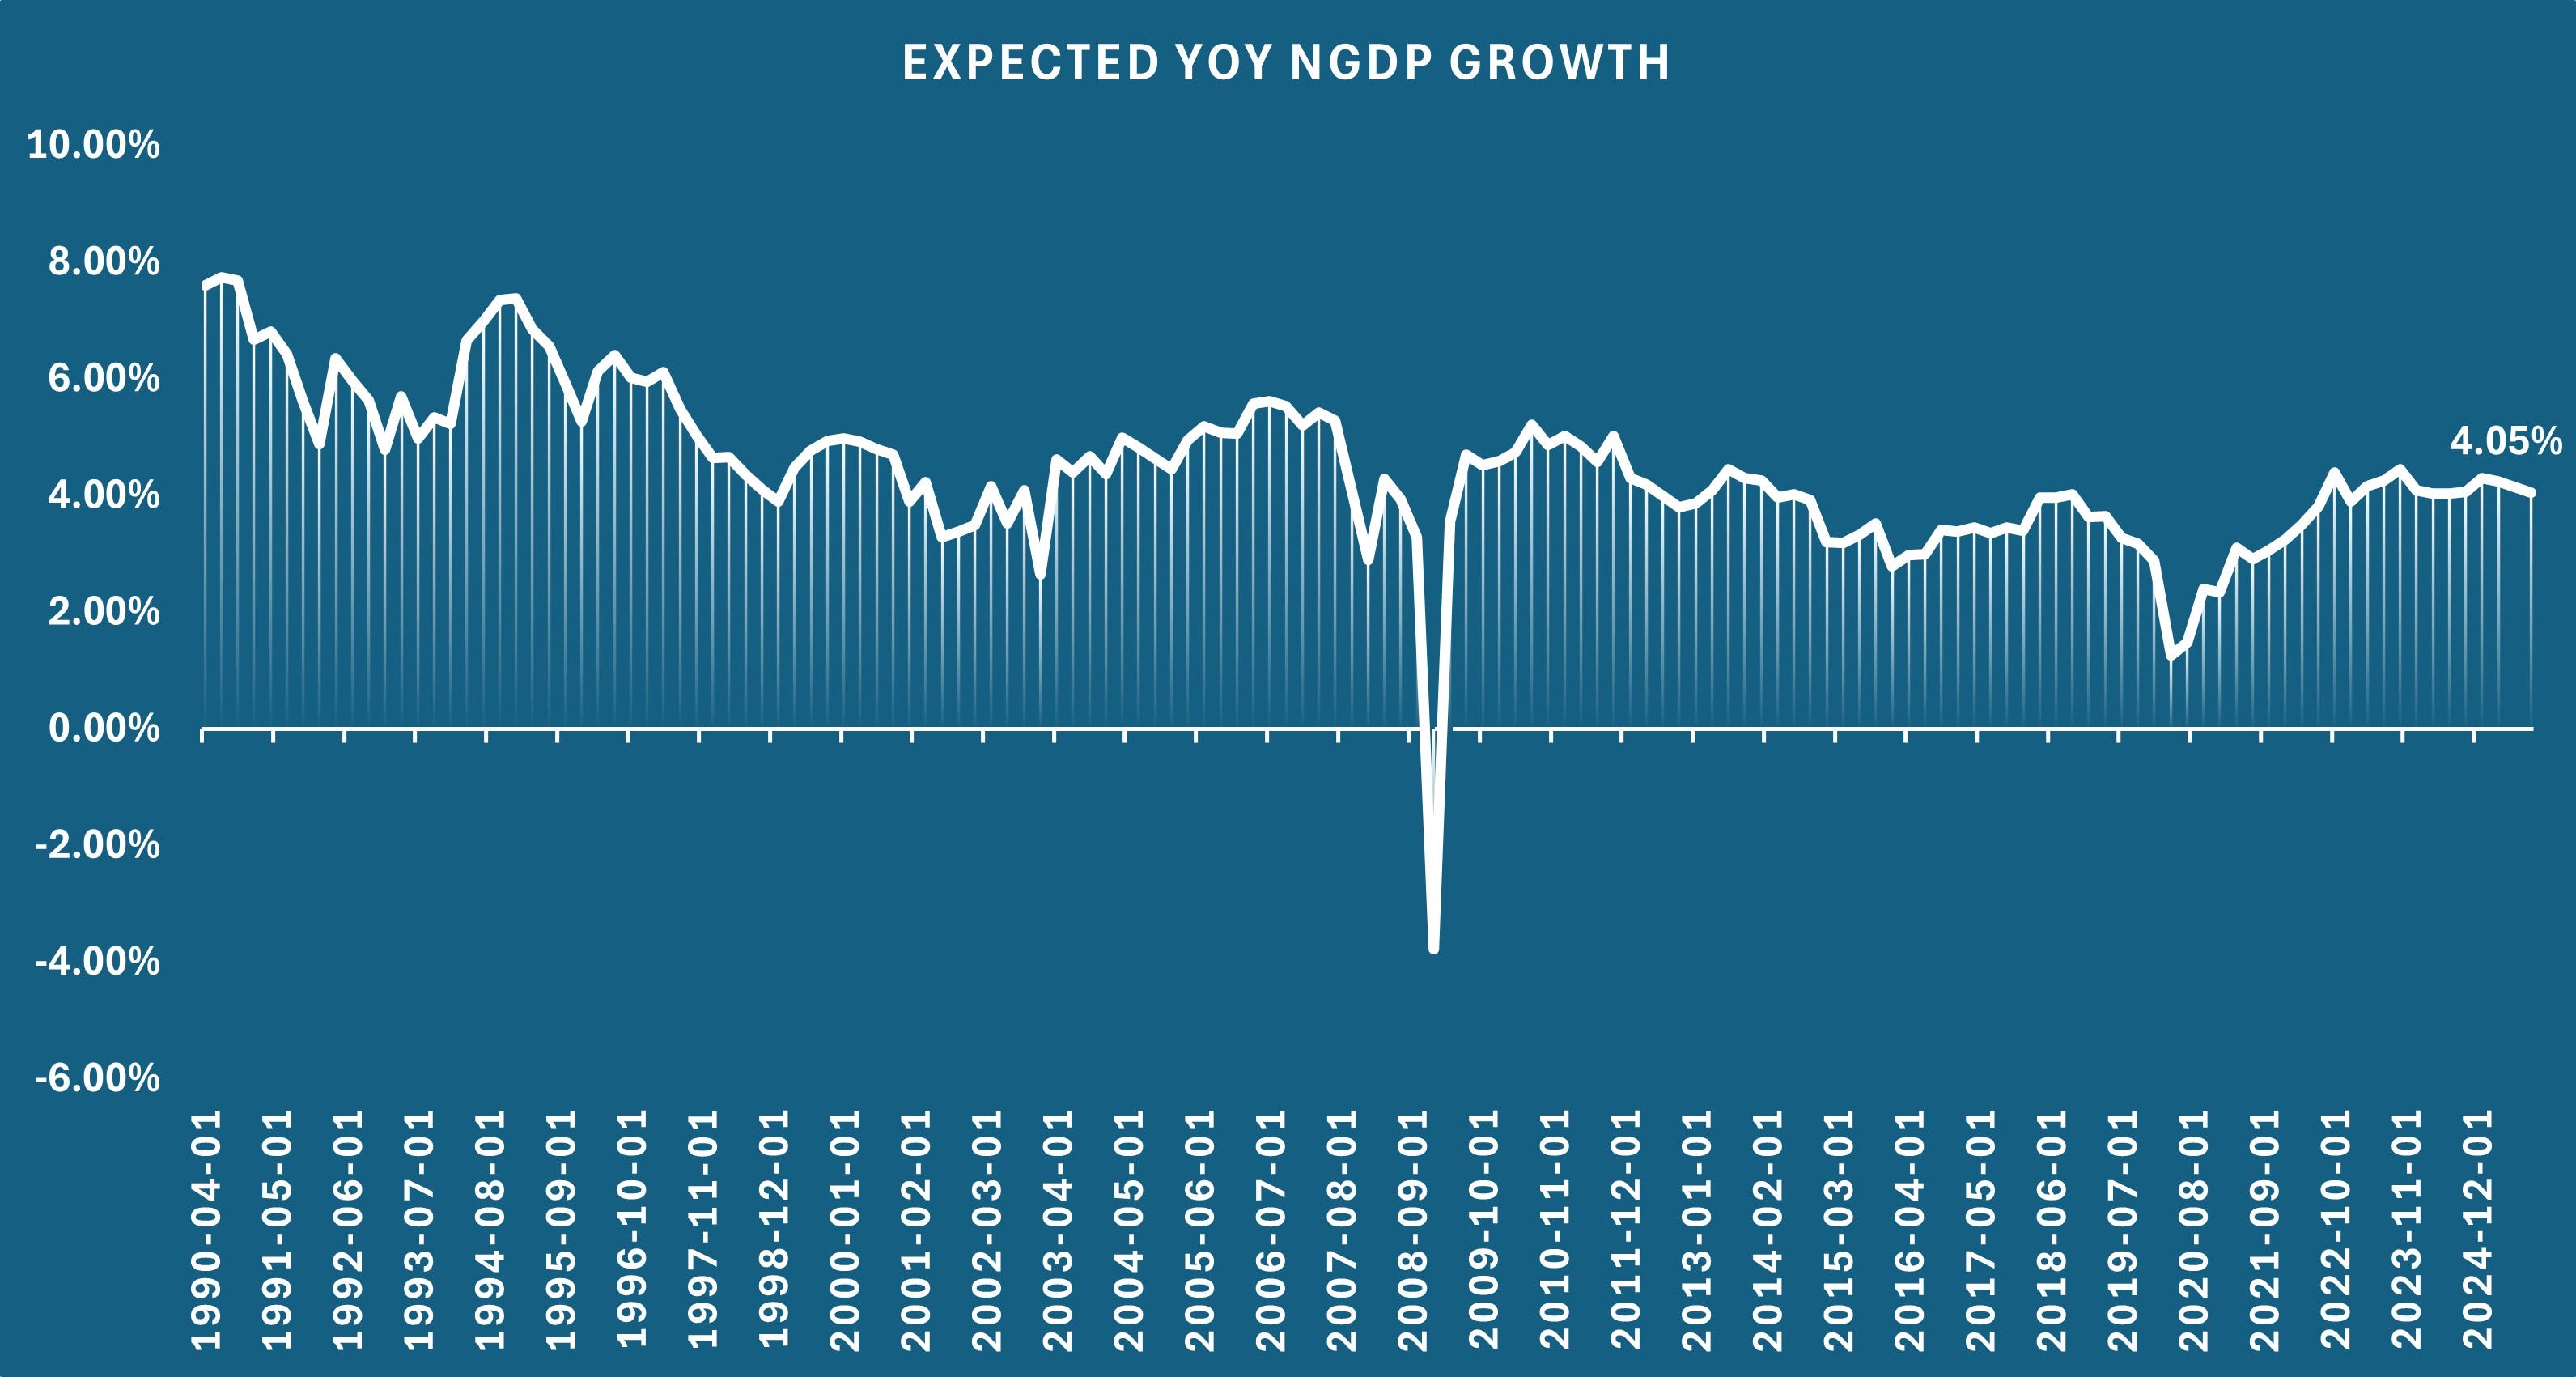
Market-Based Expected NGDP Growth

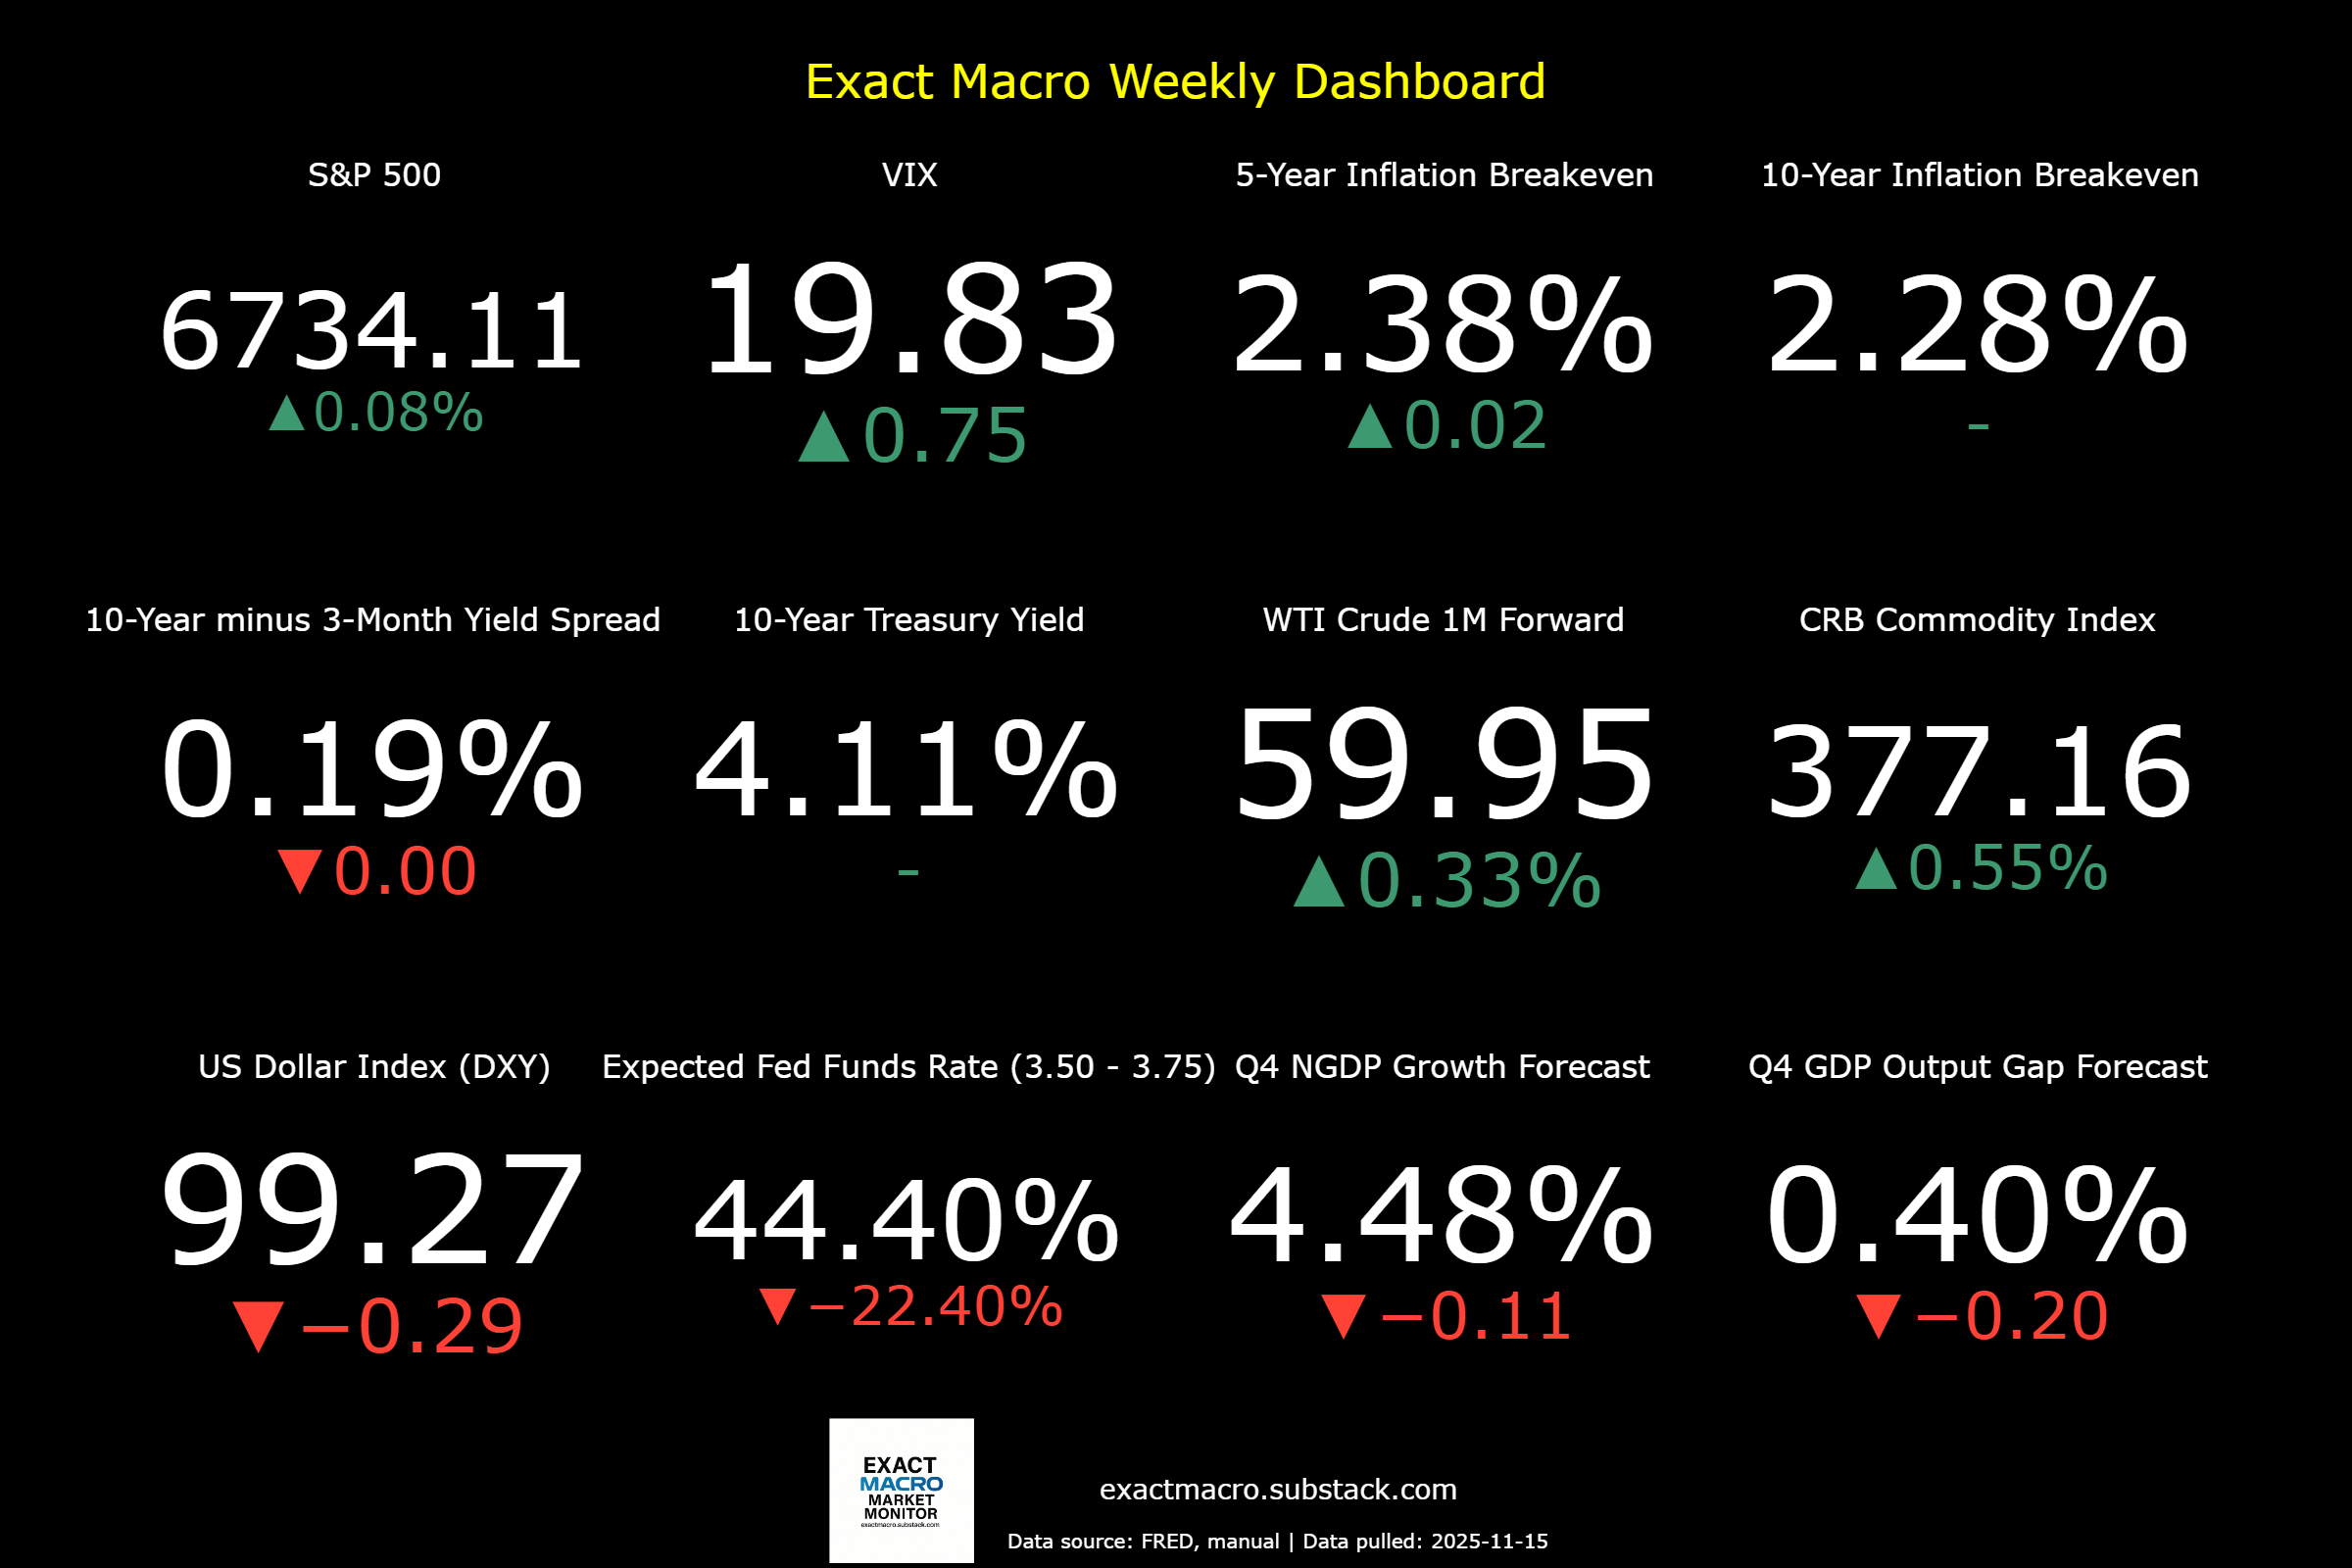
Stock prices and the mean expected NGDP growth rate slightly rose last week, as the longest ever government shutdown ended and the Fed net-signalled slightly tighter policy, causing a drop in expectations for a rate cut next month. Near-term GDP growth forecasts fell as the VIX spiked, while inflation expectations were stable.
The latest quarterly market-based NGDP growth forecasts continue to show a decline through 2026, though nowhere near negative growth. The entire forecasted NGDP growth trajectory had been trending up, consistent with the current booming economy that continues to face the headwinds of attempts to lower current inflation and immigration and trade shocks.
Now that the federal government is fully re-opening, the lull in published data should end, but the credibility of that data will continue to be questionable. I don’t see this causing problems for inflation expectations metrics such as the breakevens, because they will simply price-in any expected CPI data falsifications in the yields. However, what about metrics such as GDP? I suppose we might find out just how important this government data really is in market-terms. I’d personally rather not know. I’d prefer that politics and macroeconomics was boring, with plenty of excitement in AI and biotech fields, among other technology areas. Sadly, that’s not the world we live in, so it just happens to be timely that I begin to introduce my new proposed market-based expected NGDP metric.
The metric is composed of the average of the S&P 500 earnings yield (same-quarter earnings) and the 10-year Treasury yield. I’ve argued that both separately have long-run equilibrium relationships with NGDP growth and are usually in a state of disequilibrium due to suboptimal monetary policy.
The additional logic is that one leg (earnings yield) reflects market expectations of corporate cash-flow growth plus risk premia, while the other leg (Treasury yield) reflects the nominal cost of capital and inflation expectations. Averaging them produces a proxy for expected nominal income growth (NGDP) as perceived by the market. This metric becomes a useful operationalisation of g (expected growth) in the framework, and by implication informs r and (in equilibrium) E/P. To be explicit, the claim is that this equilibrium would be stable in a level targeting NGDP targeting monetary policy regime.
For more details, this strong EMH-consistent framework links macro-financial variables of the late 1990s/early 2000s, characterized by booming real output, flat yield curves, and high equity valuations with the novel “expected NGDP growth” metric.
At the heart of the thesis is the following equilibrium condition:
E/P = r = g
Where:
E/P is the aggregate earnings yield of the broad stock market (the inverse of P/E).
r is the required return on capital (the discount rate).
g is the long-run expected growth rate of the economy (nominal or real depending on context).
In other words, in a stable monetary regime the market prices equity such that return expectations and growth expectations align, meaning no excess spread (r − g) accumulates. Under this regime the differential risk premium between equities and Treasuries disappears because monetary and nominal-policy risk is anchored.
What this means for asset valuations is that if r and g both fall, but r falls by at least as much as g (Δr ≥ Δg), then the earnings yield (E/P) falls (i.e., P/E rises), and aggregate market valuation (market cap/GDP) increases. That mechanism explains how valuations can rise even as growth prospects may be structurally moderating. It resolves four puzzles at once:
Booming RGDP/TFP: A short-run productivity or investment boom (for example IT in the late 1990s) temporarily raised g in the short run, while markets recognised long-run structural growth ceilings were lower.
Flat long-term yield curves: Bond markets priced the headwinds to long-run growth (lower g) and anchored inflation expectations, so nominal yields did not rise dramatically despite the boom.
Low S&P earnings yield / high P/E ratios: With r falling (via lower inflation expectations, lower risk-free rates, global savings supply) and g not rising by the same magnitude, the spread (r − g) narrowed, which rationally justifies higher valuations.
High market cap/GDP ratio: Since the discount rate fell, future expected cash-flows were worth more today, increasing the ratio of equity market value to current GDP.
This is just a brief introduction to this idea. More research and commentary is needed. I will comment more on this as time allows in the near future. There is a summary which is now point 5 in the blog’s User Guide.
Note that this metric offers no advantage in forecasting GDP, just as strong EMH suggests. It’s value is similar to that of GDP reports, but it obviously has the advantage that the numbers can’t be cooked. It hence could have significant value as a policy tool and current/backward-lookind data, but not for enhancing the returns of investors.
Also note that this means that my previous attempt to capture this metric lacked the nuance of the effects of the supply of savings/capital on equity valuations and hence on NGDP growth expectations. When my model for countering factors increasing equity prices at rates above NGDP growth expectations showed too much drift, longer-term readers will recall I withdrew it. The previous model over-estimated NGDP growth expectations over some periods, including the period in which it was reported. The new model is seemingly complete, requiring no systemtic adjustments.
Your questions and comments, as always, are welcome.
Note: This post, as is the case with all my posts, should not be construed as offering investment advice. Such advice should be tailored to the individual investor by qualified professionals who, ideally, are fiduciaries.
Links to Data:
Economic Data Sources:
https://fred.stlouisfed.org/series/SP500
https://www.wsj.com/market-data/stocks/peyields
https://www.barchart.com/futures/quotes/ES*0/futures-prices
https://ycharts.com/indicators/sp_500_earnings_per_share_forward_estimate#:~:text=Basic%20Info-,S&P%20500%20Earnings%20Per%20Share%20Forward%20Estimate%20is%20at%20a,28.27%25%20from%20one%20year%20ago.
https://www.cnbc.com/quotes/.VIX
https://fred.stlouisfed.org/series/DTWEXBGS
https://fred.stlouisfed.org/graph/?g=Ee9i
https://fred.stlouisfed.org/series/T10Y3M#0
https://fred.stlouisfed.org/series/DGS10
https://www.cmegroup.com/trading/interest-rates/countdown-to-fomc.html
https://tradingeconomics.com/commodity/crb?user=nunote
https://www.cnbc.com/quotes/@CL.1
https://www.cmegroup.com/trading/en
https://www.spglobal.com/spdji/en/documents/additional-material/sp-500-eps-est.xlsx
https://www.cmegroup.com/markets/interest-rates/stirs/30-day-federal-fund.quotes.htmla