
Stock and GDP Outlook, for Week Ending 08/15/2025
Treasury Yields are NGDP Growth Forecasts

Note: This week’s market outlook post will be quite different, with some important changes announced. I will outline firm reasons to believe that Treasury yields represent NGDP forecast, which will greatly impact the blog going forward. More is to follow, after the updated outlook.
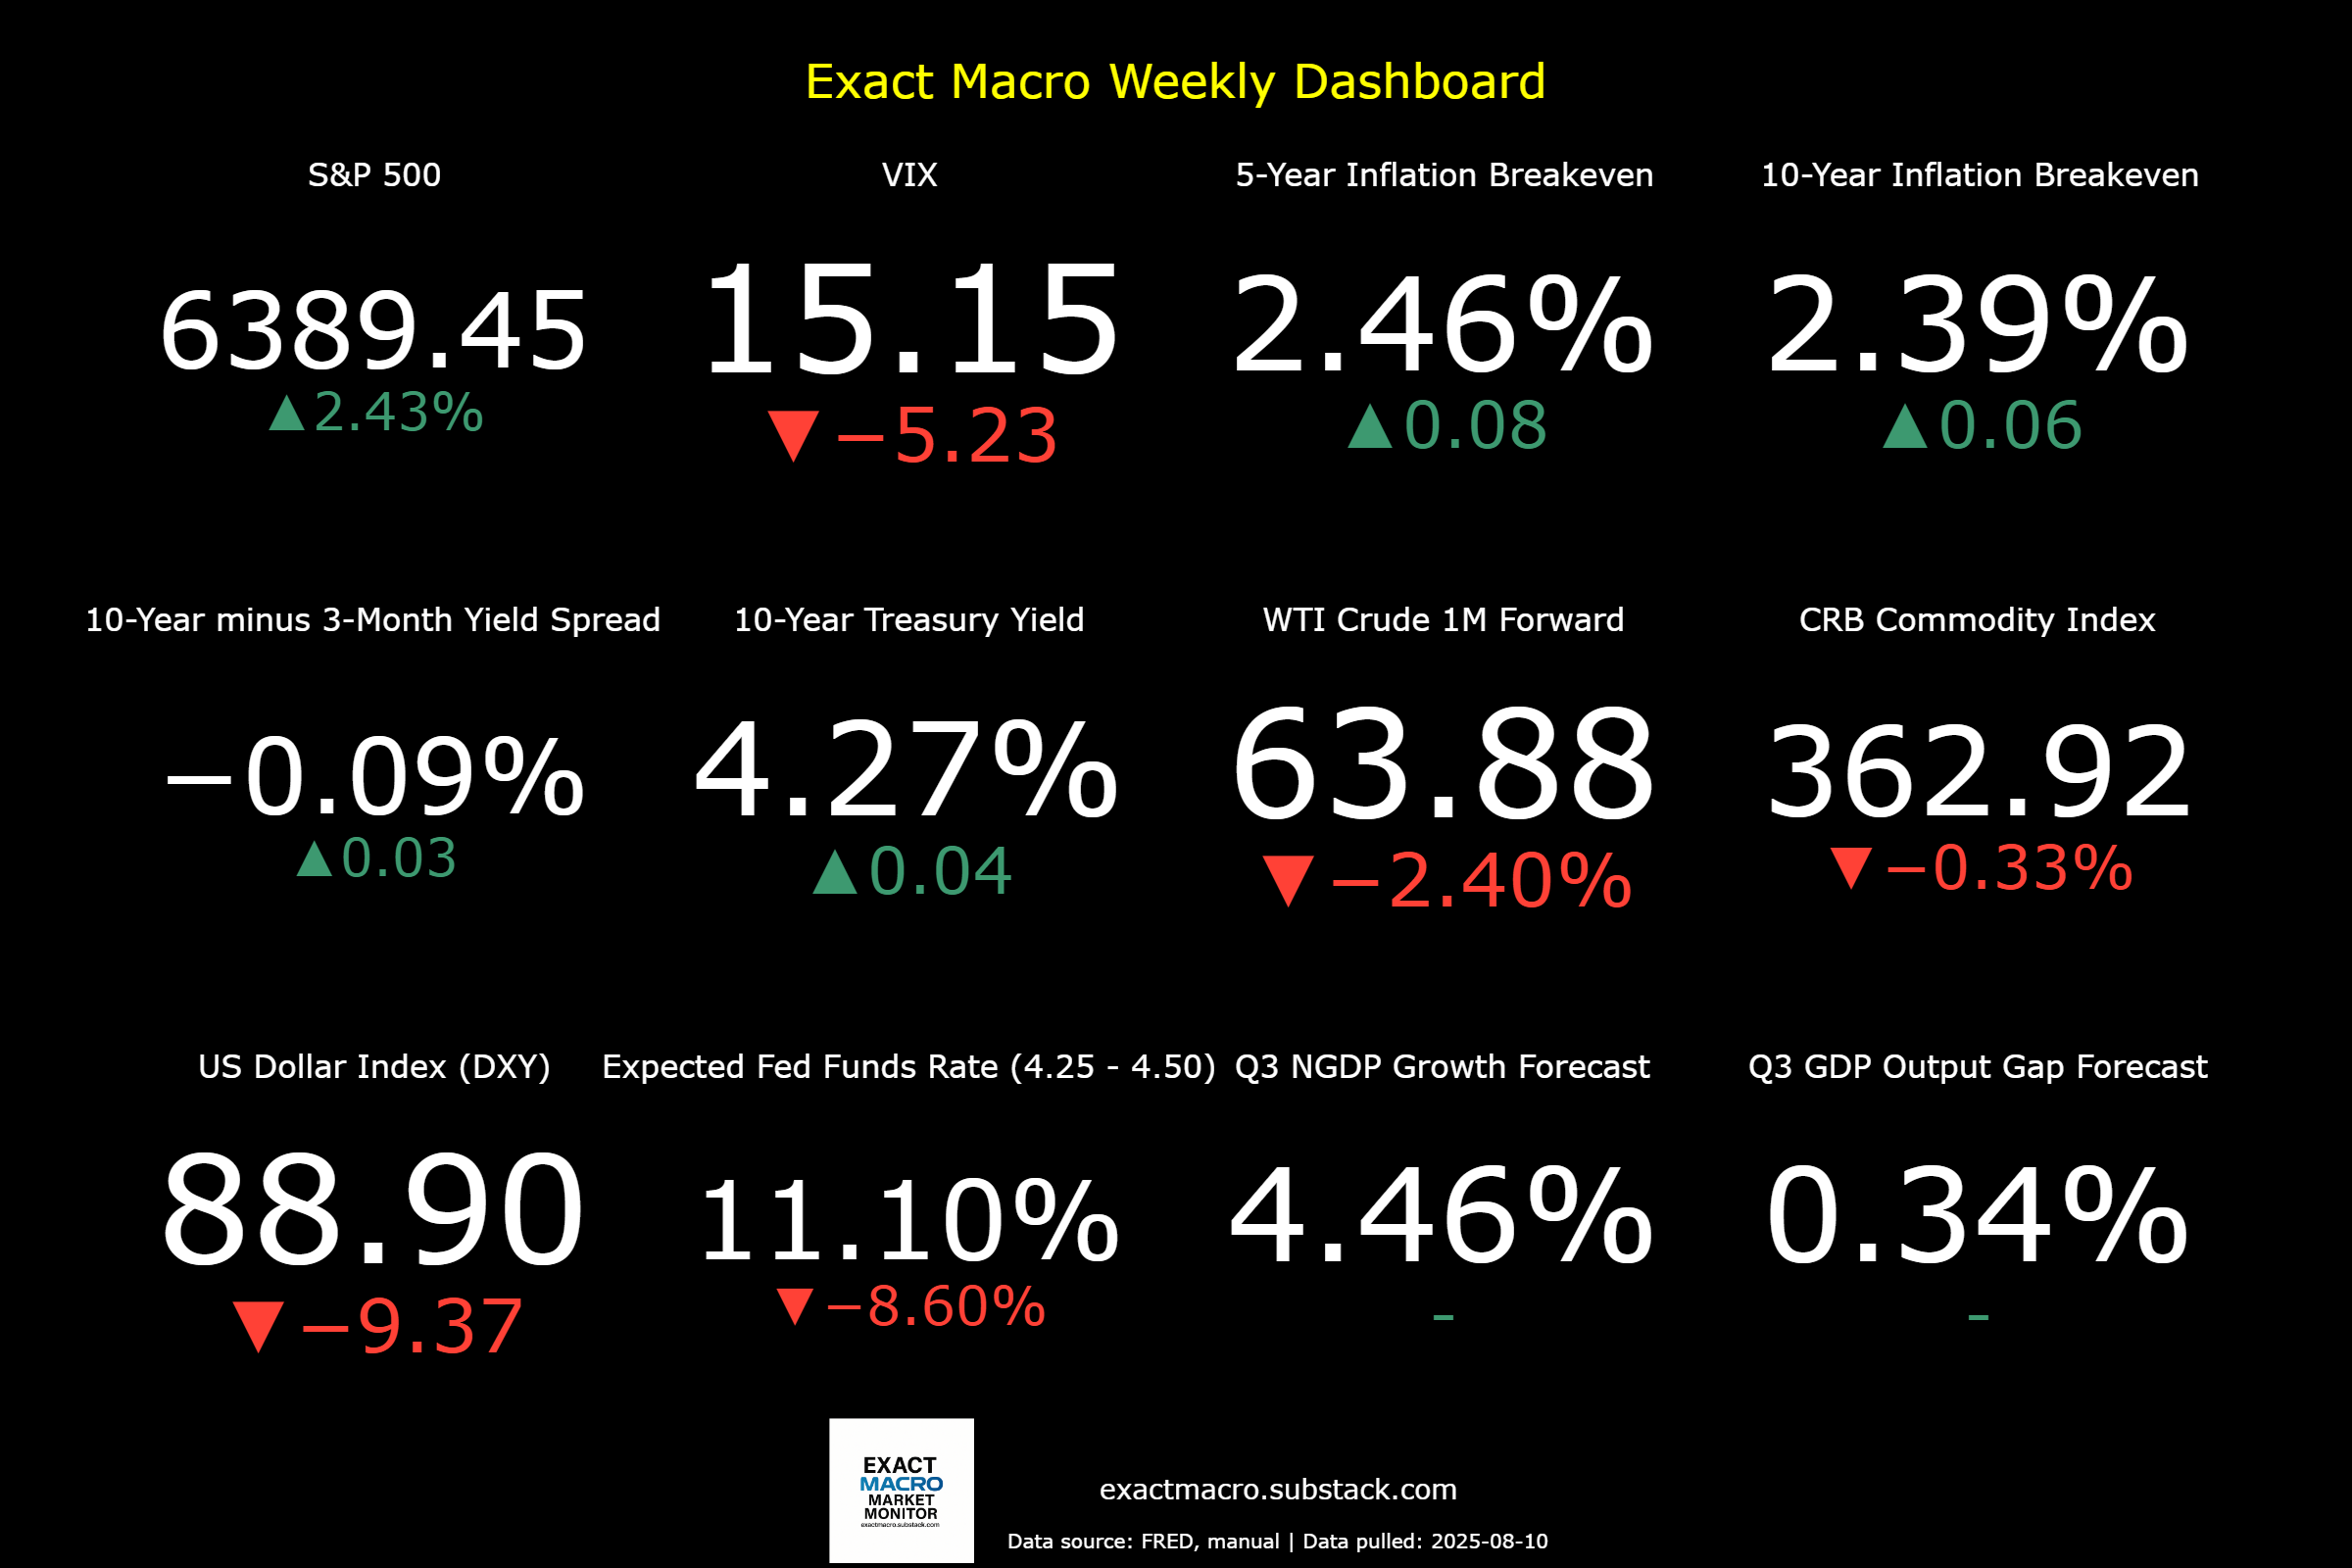
Outlook: Stock prices and the mean expected NGDP growth rate increased sharply again last week, as commodity prices fell, but inflation expectations rose. The gains in stock prices and expected NGDP growth were entirely nominal, despite a better-than-expected labor productivity report from the BLS.
Speaking of the BLS and numbers we probably can’t trust, Trump invited Stephen Moore to the White House for a press conference to present “secret” data that were said to be given to the Heritage Foundation prior to official release. The data presented on cardboard charts depicted vastly better economic results for most Americans under the first Trump administration versus that of Biden. Given the nature of this preferential release, which is illegal if the way it was stated is true, and the huge discrepancy between the numbers in Trump’s favor, I’m more than skeptical about its validity.
Hence the outlook hasn’t changed much from last week. There is a bit more inflation to add to the expected mild stagflation mix that is increasingly characterizing the economy and the Trump administration managed to undermine its credibility even further, which was not an easy feat, after the announcements of sudden, capricious, ever-shifting tariff rates on most countries in the world (and even some non-political entities) and the firing of the BLS commissioner for honest job reports. While the outlook remains mostly positive, as stated last week, the tail risks Trump represents are unprecedented, along with some deteorating cirumstances overseas. A prime example of the latter is Israel’s apparent plan to begin taking over Gaza City. Be careful.
What’s New: Some longer time readers may recall that I’ve mentioned that there may be an equilibrium relationship between Treasury yields and expected NGDP growth rates. This was based on the same principle as the equilibrium relationship between the S&P 500 earnings yield and the NGDP growth rate. That is based on the neoclassical principle that the rate of return on capital should equal the economic growth rate. I’ve stated that principle on this blog many, many times. It is the basis for the NGDP rate output gap measure and the market-based NGDP forecasts.
Why would it apply to Treasury yields? I see many of the distinctions between savings and investment as being arbitrary. Even the differential risks of holding Treasuries versus an S&P 500 index fund would disappear in the context of stable monetary policy, such as NGDP level targeting.
I’ll go further now though and say that the Treasury yield curve largely directly represents NGDP growth expectations. That is, that the 30-year yield, for example, represents the average expected NGDP growth rate over that period.
I suspect this idea will seem absurd on its face, but it’s not close to being new and has more justification than you might expect. The seeds of the idea go back as far as Adam Smith and David Ricardo, while appearing as a formal theorem in von Neumann’s famous 1937 (republished in 1945) paper “A Model of General Economic Equilibrium”, which applied linear programming to macroeconomics.
While the idea has long seemed intutively appealing to me, I never quite felt I could make a strong enough case for it, until I realized significant support was in plain sight. It’s in the well-accepted cost and carry arbitrage identity of stock index futures pricing. The arbitrage relationship is: the futures price (F) is equal to the spot price (S) compounded by the net cost of carry, which is the risk-free rate (r) minus the dividend yield (q). This is expressed as:
It is stated here as F=S*e^(r−q)T, where
F = stock index futures price
T = The time to maturity in years
S = spot price of the index
r = continuously compounded risk-free rate to TTT
q = continuously compounded dividend yield over [0,T][0,T][0,T]
e = Euler’s number
Basically, this states that the futures price is equal to the spot price compounded by the net cost of carry, which is the risk-free rate minus the dividend yield. That is to say, if you buy the asset now, you give up the interest you could have earned (r) but you receive dividends (q). If you buy via a futures contract, you keep your cash earning interest (r) but miss out on dividends (q). The futures price adjusts for this trade-off. You can find a more detailed explantion in the blog’s User Guide here.
Coupled with the logic and evidence supporting the equilibrium relationship between the S&P 500 and the NGDP growth rate, I consider this claim at least worthy of consideration. If the S&P 500 earnings yield is a proxy for NGDP growth, and the futures pricing identity holds, then the risk-free rate (Treasury yields) must be tightly linked to NGDP growth as well.
An obvious implication is that I doubt there is such a thing as much of a term premium in Treasuries, despite the obvious fact that non-Treasury lending usually comes with higher interest rates at longer maturities. I see this as likely reflecting default risk, sans time preference. While time preference exists on the micro scale, it is arbitraged away on the macro scale. Default risk obviously doesn’t exist on a “risk-free” asset. While Treasuries are not literally entirely risk-free, any term premia are probably slight. However, even if the risk of default grows, this would often lead to a situation of fiscal dominance in which the term premium would largely equate to the inflation premium, which would then apply equally to NGDP growth.
There are limits to this relationship. For example, the Fed routinely distorts short-term interest rates and sometimes even long rates. The latter occurred as a result of Operation Twist, which sought to sell shorter-run in favor of longer-run maturities to try to boost economic growth during the slow Great Recession recovery.
There are also sometimes liquidity problems in the Treasury market during crises and sometimes even sans crises, but these situations are rare and usually quickly remedied by the Fed. In a world in which the Fed was using Treasury yields to guide an NGDP level target, the market would be more stable anyway. This would also provide a very direct test of this idea. If the yield curve did not become flat at the NGDP target rate, assuming Fed credibility, then the idea would obviously be wrong.
I suspect this idea wasn’t widely adopted on a permanent basis previously due to the relevant data being distorted during the Gold Standard era.
Changes to this blog: I now find this idea compelling enough to let it begin to inform metrics used. If I’m correct, the 30-year Treasury yield offers the most explicit market estimate of the mean expected NGDP growth rate over that period. Since that figure and others on the yield curve are lower than the estimates based on consensus S&P 500 earnings estimates and S&P 500 futures prices, I will replace the 4.6% estimated sustainable NGDP growth rate with the mean trend rate since just prior to the Great Recession, which is much closer to those in the yield curve. That rate is about 4.29%. Consistent with this, I’ll be eliminating the forecasted NGDP growth rate gap that is based on the estimated sustainable NGDP growth rate. Only the raw growth rate gap forecast will remain.
I will continue to offer the quarterly NGDP forecasts, because as stated above, short-term Treasuries, which is roughly those with maturities of less than 2 years, reflect Fed Funds policy rather than NGDP forecasts.
Comments or questions are welcome, particularly if they are challenging.
Note: This post, as is the case with all my posts, should not be construed as offering investment advice. Such advice should be tailored to the individual investor by qualified professionals who, ideally, are fiduciaries.
Links to Data:
Economic Data Sources:
https://fred.stlouisfed.org/series/SP500
https://www.wsj.com/market-data/stocks/peyields
https://www.barchart.com/futures/quotes/ES*0/futures-prices
https://ycharts.com/indicators/sp_500_earnings_per_share_forward_estimate#:~:text=Basic%20Info-,S&P%20500%20Earnings%20Per%20Share%20Forward%20Estimate%20is%20at%20a,28.27%25%20from%20one%20year%20ago.
https://www.cnbc.com/quotes/.VIX
https://fred.stlouisfed.org/series/DTWEXBGS
https://fred.stlouisfed.org/graph/?g=Ee9i
https://fred.stlouisfed.org/series/T10Y3M#0
https://fred.stlouisfed.org/series/DGS10
https://www.cmegroup.com/trading/interest-rates/countdown-to-fomc.html
https://tradingeconomics.com/commodity/crb?user=nunote
https://www.cnbc.com/quotes/@CL.1
https://www.cmegroup.com/trading/en
https://www.spglobal.com/spdji/en/documents/additional-material/sp-500-eps-est.xlsx
https://www.cmegroup.com/markets/interest-rates/stirs/30-day-federal-fund.quotes.html