
Stock and GDP Outlook, for Week Ending 02/14/2025
Trading in Chaos

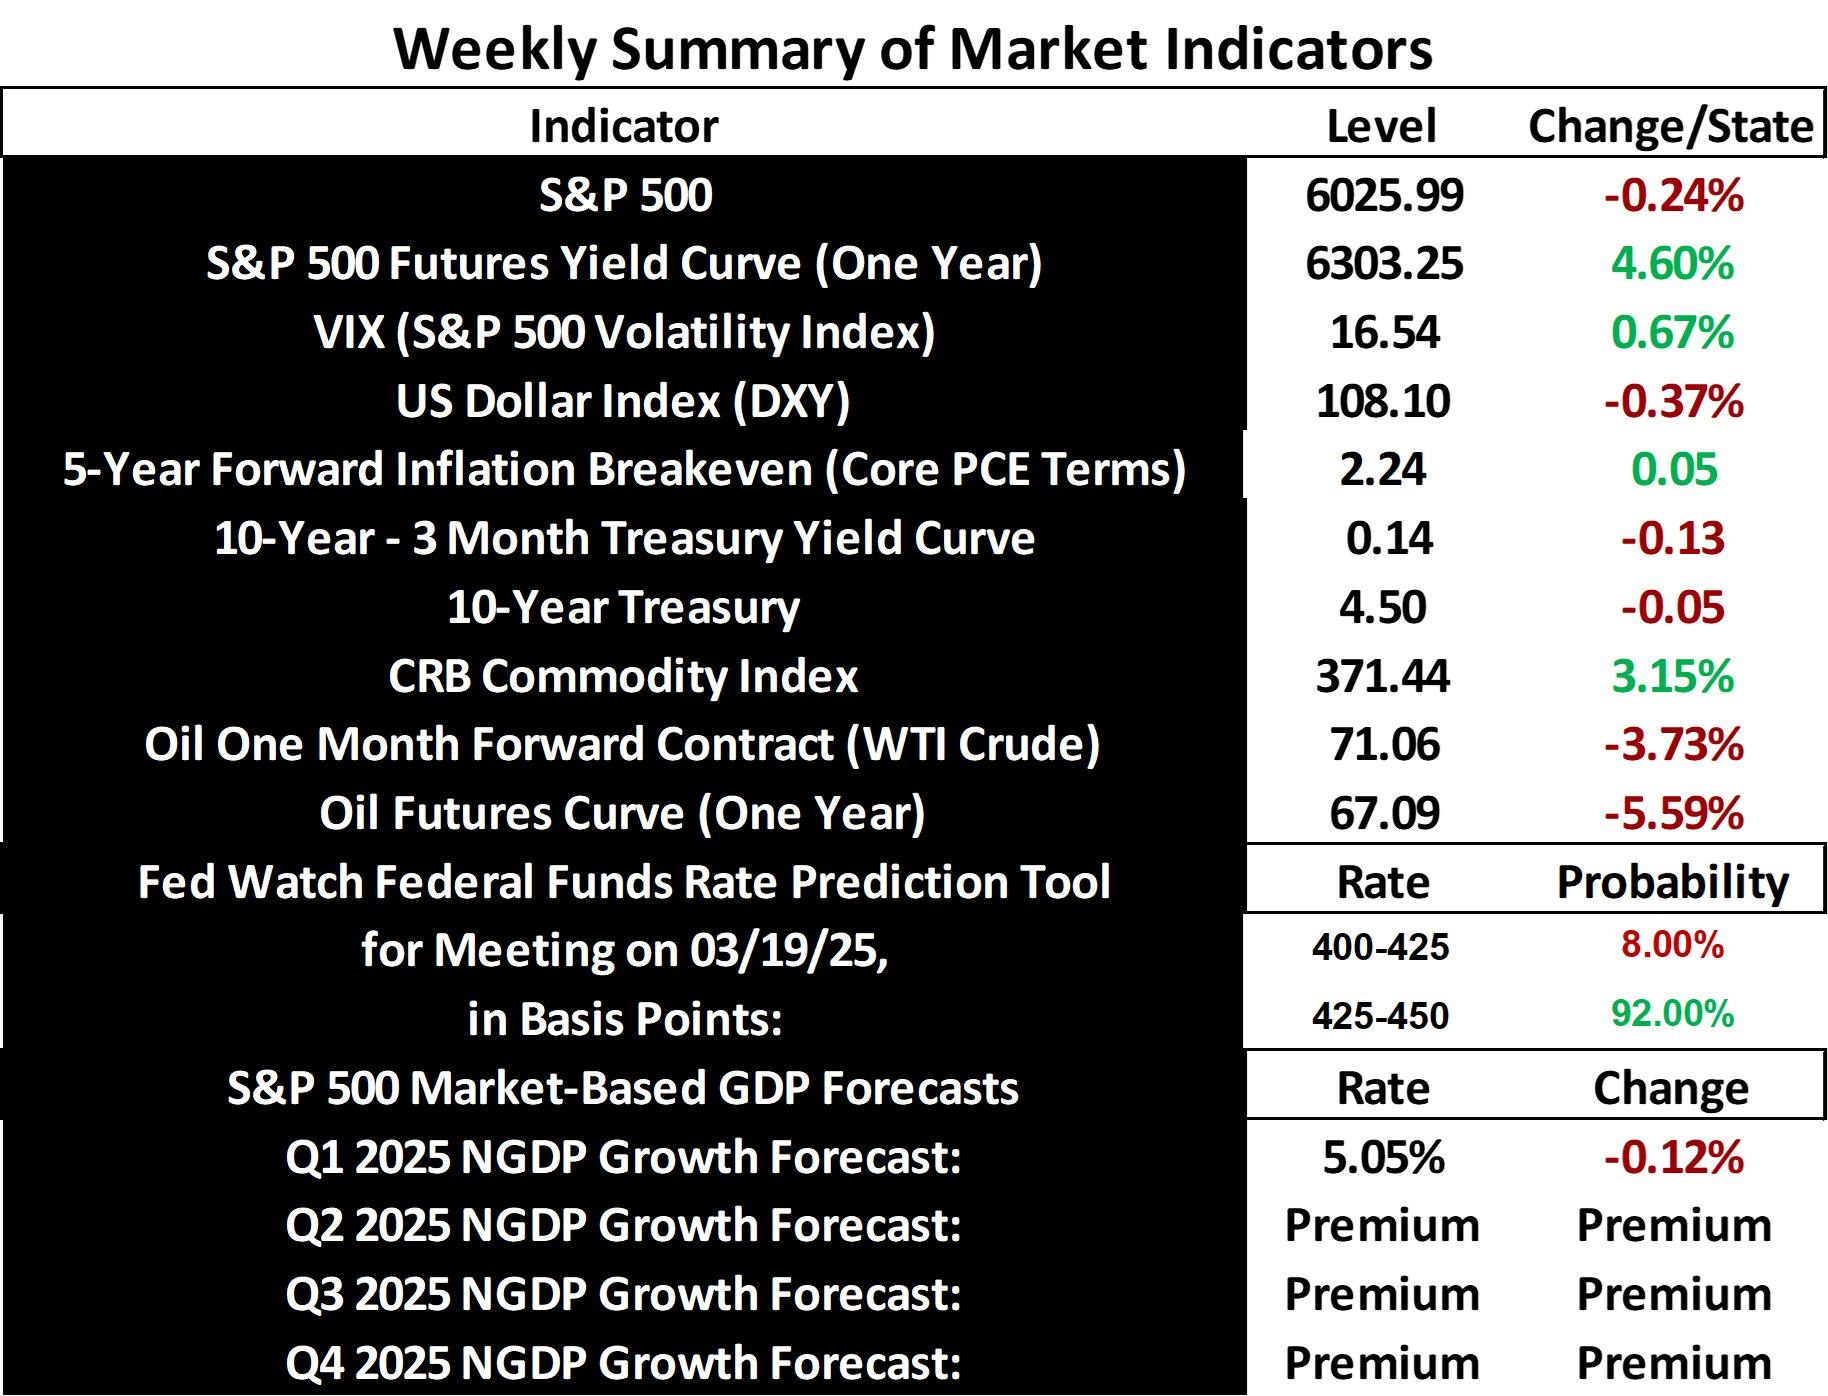
Stock prices and the mean expected NGDP growth rate fell last week as trade wars with Canada and Mexico were postponed for a month, while China retaliated against new 10% US tariffs with some tariffs as high as 15%. However some of the new tariffs on China were paused. Looking ahead, new tariffs on steel and aluminum were just announced, with some of the supply coming from Canada and Mexico. You’ll be forgiven if you start to ask whether the Trump administration is operating based on a coherent plan. While the response of the stock market to this news and other chaos in Washington has been negative, it’s been muted so far. There is still the expectation that there will not be persistent net negative economic policies adopted.
At the same time last week, inflation expectations continued to creep up and are now 24 basis points above the Fed’s target, while long-term Treasury yields fell, placing even more doubt on continued potential gains in stock prices. Also, the jobs report superficially disappointed, with an associated reduction in unemployment that serves as yet more evidence the economy is running hot. The combination of an economy stubbornly running above capacity and unpredictable policy in Washington continues to make stocks a risky bet as long as these trends continue. Extreme caution is warranted, at least.
Now I have some notes for changes regarding data offered on this blog. First, the explicit mean expected NGDP growth rate figure has been retired, at least for now, due to a flaw in the model that allows for data drift. I will bring the metric back, if the model flaw can be fixed. Also, the sustainable NGDP growth rate estimate in the model for forecasting quarterly NGDP growth was lowered this week from 5% to 4.6%, as data over the past few quarters has suggested the original estimate was too high. This change is reflected in this week’s updated quarterly S&P 500-based NGDP forecasts. One doesn’t have to agree with the estimate to note the expected change in NGDP growth reflected in the expected S&P 500 earnings yield. More details about this forecast model can be found in the blog reader’s guide.
Note: This post, as is the case with all my posts, should not be construed as offering investment advice. Such advice should be tailored to the individual investor by qualified professionals who, ideally, are fiduciaries.
Economic Data Sources:
https://fred.stlouisfed.org/series/SP500
https://www.wsj.com/market-data/stocks/peyields
https://www.barchart.com/futures/quotes/ES*0/futures-prices
https://ycharts.com/indicators/sp_500_earnings_per_share_forward_estimate#:~:text=Basic%20Info-,S&P%20500%20Earnings%20Per%20Share%20Forward%20Estimate%20is%20at%20a,28.27%25%20from%20one%20year%20ago.
https://www.cnbc.com/quotes/.VIX
https://fred.stlouisfed.org/series/DTWEXBGS
https://fred.stlouisfed.org/graph/?g=Ee9i
https://fred.stlouisfed.org/series/T10Y3M#0
https://fred.stlouisfed.org/series/DGS10
https://www.cmegroup.com/trading/interest-rates/countdown-to-fomc.html
https://tradingeconomics.com/commodity/crb?user=nunote
https://www.cnbc.com/quotes/@CL.1
https://www.cmegroup.com/trading/en
https://www.spglobal.com/spdji/en/documents/additional-material/sp-500-eps-est.xlsx
https://www.cmegroup.com/markets/interest-rates/stirs/30-day-federal-fund.quotes.html