

Stock and GDP Outlook, for Week Ending 04/19/2024
Stock and GDP Outlook, for Week Ending 04/19/2024
A Hot Take on the Outlook

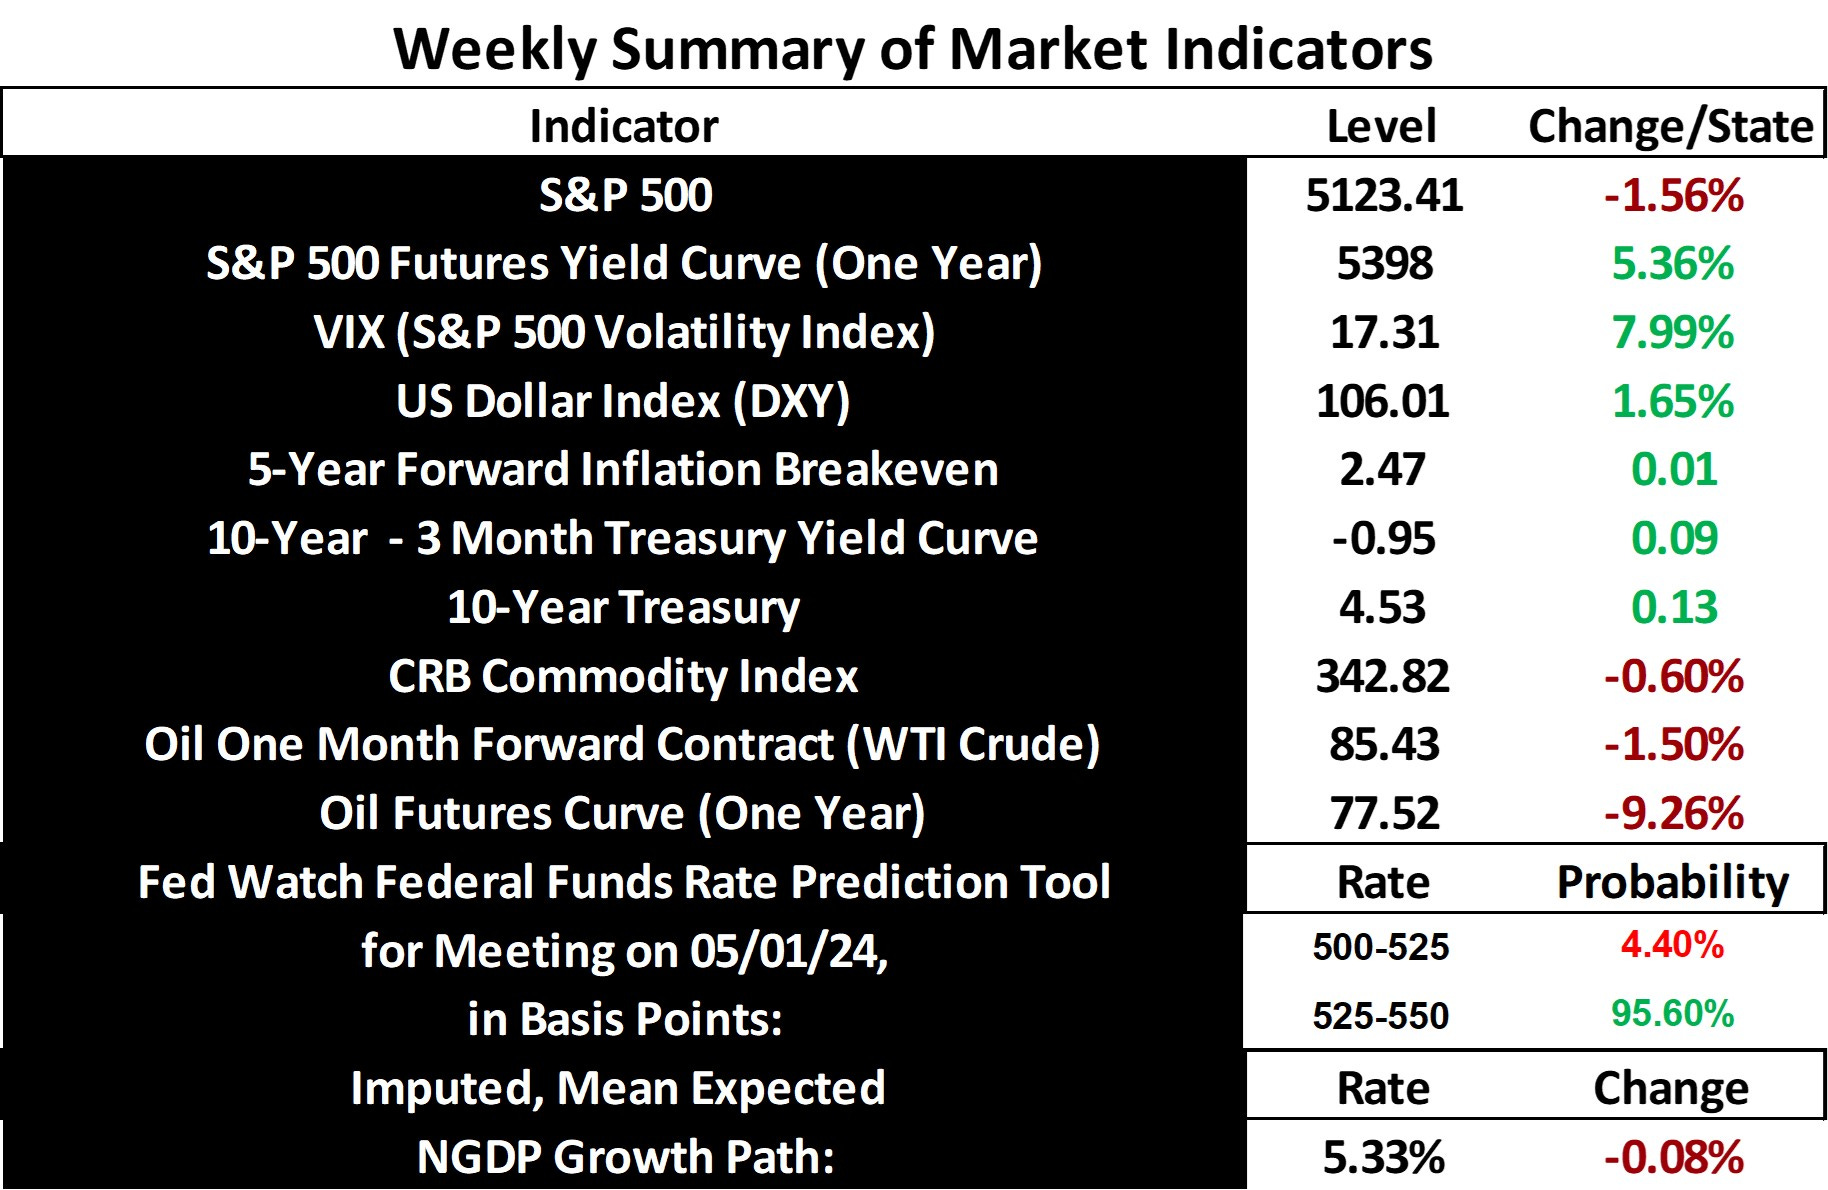
Stock prices and the mean expected NGDP growth rate fell sharply for the second straight week, as volatility surged and inflation expectations continued creeping above the Fed’s desired target. Also, 10-year Treasury yields again spiked, pushing above 450 basis points. This worsening of market conditions was very much tied to a hotter-than-expected CPI report for March. It’s also worth noting the escalation of the conflict in the Middle East, which is requiring ever more vigilence from investors.
Obviously, to echo a warning offered on this blog for several weeks now, these events warrant continued caution for those not inclined to buy and hold. A sudden shift in Fed policy to bring inflation immediately to target could lead to a roughly 35% decline in stock prices. If the Fed overshoots on the way down, it could be even worse, though mistakes of a much smaller magnitude are more likely.
No such sudden shift in policy is currently expected, but rising inflation due to geopolitical events could make such a policy error more likely. Indeed, we’re faced with quite the opposite problem right now, as the Fed has been loosening monetary policy for 2 quarters. So, if anything, the economy remains too strong, but with growing headwinds and increased risks for further policy errors.
Data Note:
Now, before closing, I’d like to address the issue of the S&P 500-based mean expected NGDP growth rate that I’ve offered since the relatively early days of this blog. I mentioned earlier this year that I was developing an alternative way to estimate this value, as I was concerned with the precision of my current method perhaps suffering over long time frames. That concern has been allayed.
I also wanted to provide a more straightforward and transparent method to make this estimate, which I’ve done via a measure of the NGDP growth output gap. I do this, for example, by taking the midpoint value of the NGDP growth rate and the concurrent quarter, annualized S&P 500 earnings yield. That value represents not only mean expected NGDP, but equilibrium NGDP, since it’s expectations that set the equilibrium growth rate. Hence, for Q4 of last year for example, the midpoint value was about 4.94%, which essentially perfectly matches the value determined using my original calculation method. I’m pleased to see that the drift I feared may be present using the original method has not materialized.
Note: This post, as is the case with all my posts, should not be construed as offering investment advice. Such advice should be tailored to the individual investor by qualified professionals who, ideally, are fiduciaries.
Links to Data: