

Stock and GDP Outlook, for Week Ending 12/22/2023
Stock and GDP Outlook, for Week Ending 12/22/2023
Booming Optimism


Stock prices and the mean expected NGDP growth rate rose yet again last week, for the 7th consecutive time. Oil prices and inflation expectations also climbed, while the VIX continued its long decline. There was also a notably large move downward in Treasury yields and significant steepening of the negative yield curve. It’s also worth noting that oil prices, however, despite being up last week, are now down over 23% since their 2023 high reached in late September.
These facts suggest that both a positive real and nominal shock occurred last week, at least with regard to long-term growth expecations. This was due to forecasted Fed Funds rate cuts in the Fed’s dot plot, which represents the first such forecasts for a lower Fed Feds rate since the worst of the pandemic shock. As a result, the Fed Funds futures market is no longer pricing in the possibility of even a small rate increase.

And now, just as with the 10-year Treasury yield, the Fed Funds rate is predicted to fall below 4%, in the case of the latter, by early 2025. So, the outlook for stocks and the economy has improved since last week.
However, there is an issue I’d like to address, regarding the longer-term outlook. In recent blog posts, including last week’s, I presented graphs of both real GDP and the employment level versus trend, with the baseline for the trends consisting of 5 years of pre-pandemic data. This 5-year baseline is very similar to the 10-year pre-pandemic baseline, and this is a baseline I commonly see others use for the same purpose. However, Scott Sumner has convinced me that this is an inappropriate baseline, because it only includes years of economic expansion, in which unemployment was falling. It is obviously reasonable to think real economic growth will slow at full-employment, ceteris paribus. So, here’s RGDP versus the 13-year pre-pandemic trend:

Obviously, this suggests a very different long-term outlook for real growth than that using the 5- or 10-year baseline, both of which had RGDP below trend. This would take the expected long-term RGDP growth rate down to around 1.8%.
Similarly, the employment level is also above trend, rather than below it, using the same 13-year pre-pandemic baseline.

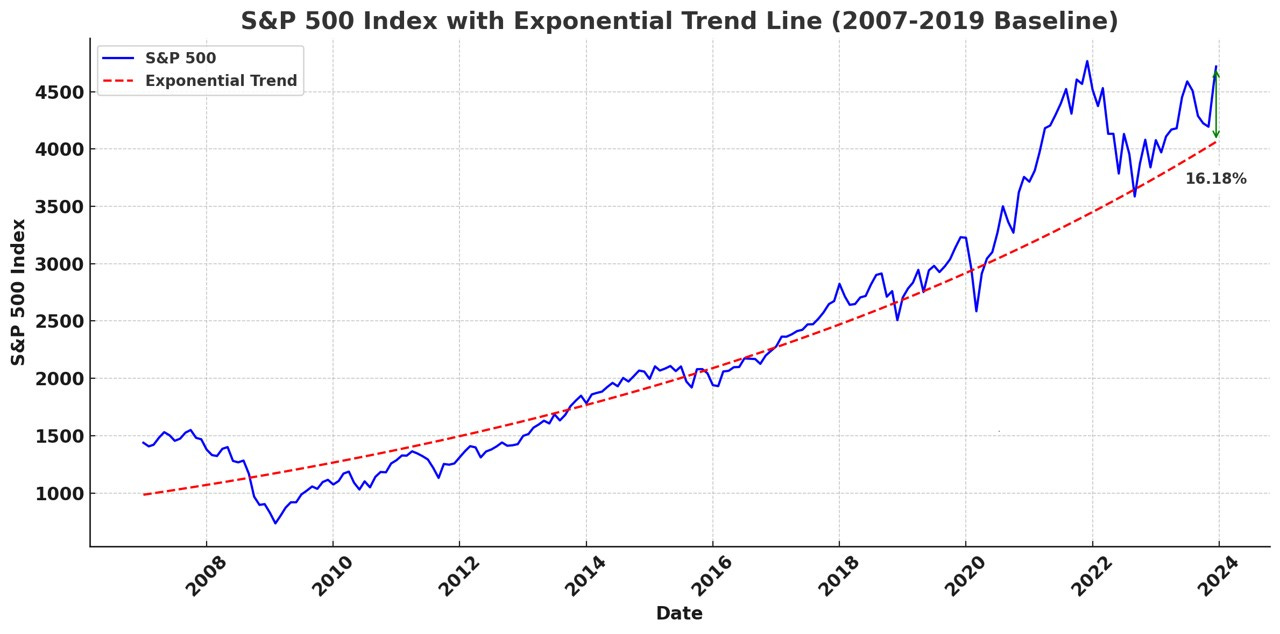
And the same holds true for the S&P 500.
However, this doesn’t necessarily change my short- or long-term outlook that much. That’s because, even if one accepts that the economy is still running hot, inflation expectations continue to range below the Fed’s 2% target in core PCE terms. As I’ve been pointing out recently, there’s still room for higher NGDP growth expectations, given the Fed’s inflation targeting framework, which tends to be procyclical. Unless the Fed adopts a non-procyclical regime soon, such as when announcing the results of its 5-year monetary policy framework review in summer of 2025, we can expect the Fed to run the economy hot, as long as inflation is tame.
Also, such simple extrapolation is obviously not always reliable, and we all know we’re in the midst of an AI revolution that will very likely, eventually, lead to a productivity boom, and then a boom in the boom, likely in perpetuity.
Note: This post, as is the case with all my posts, should not be construed as offering investment advice. Such advice should be tailored to the individual investor by qualified professionals who, ideally, are fiduciaries.
Links to Data: