

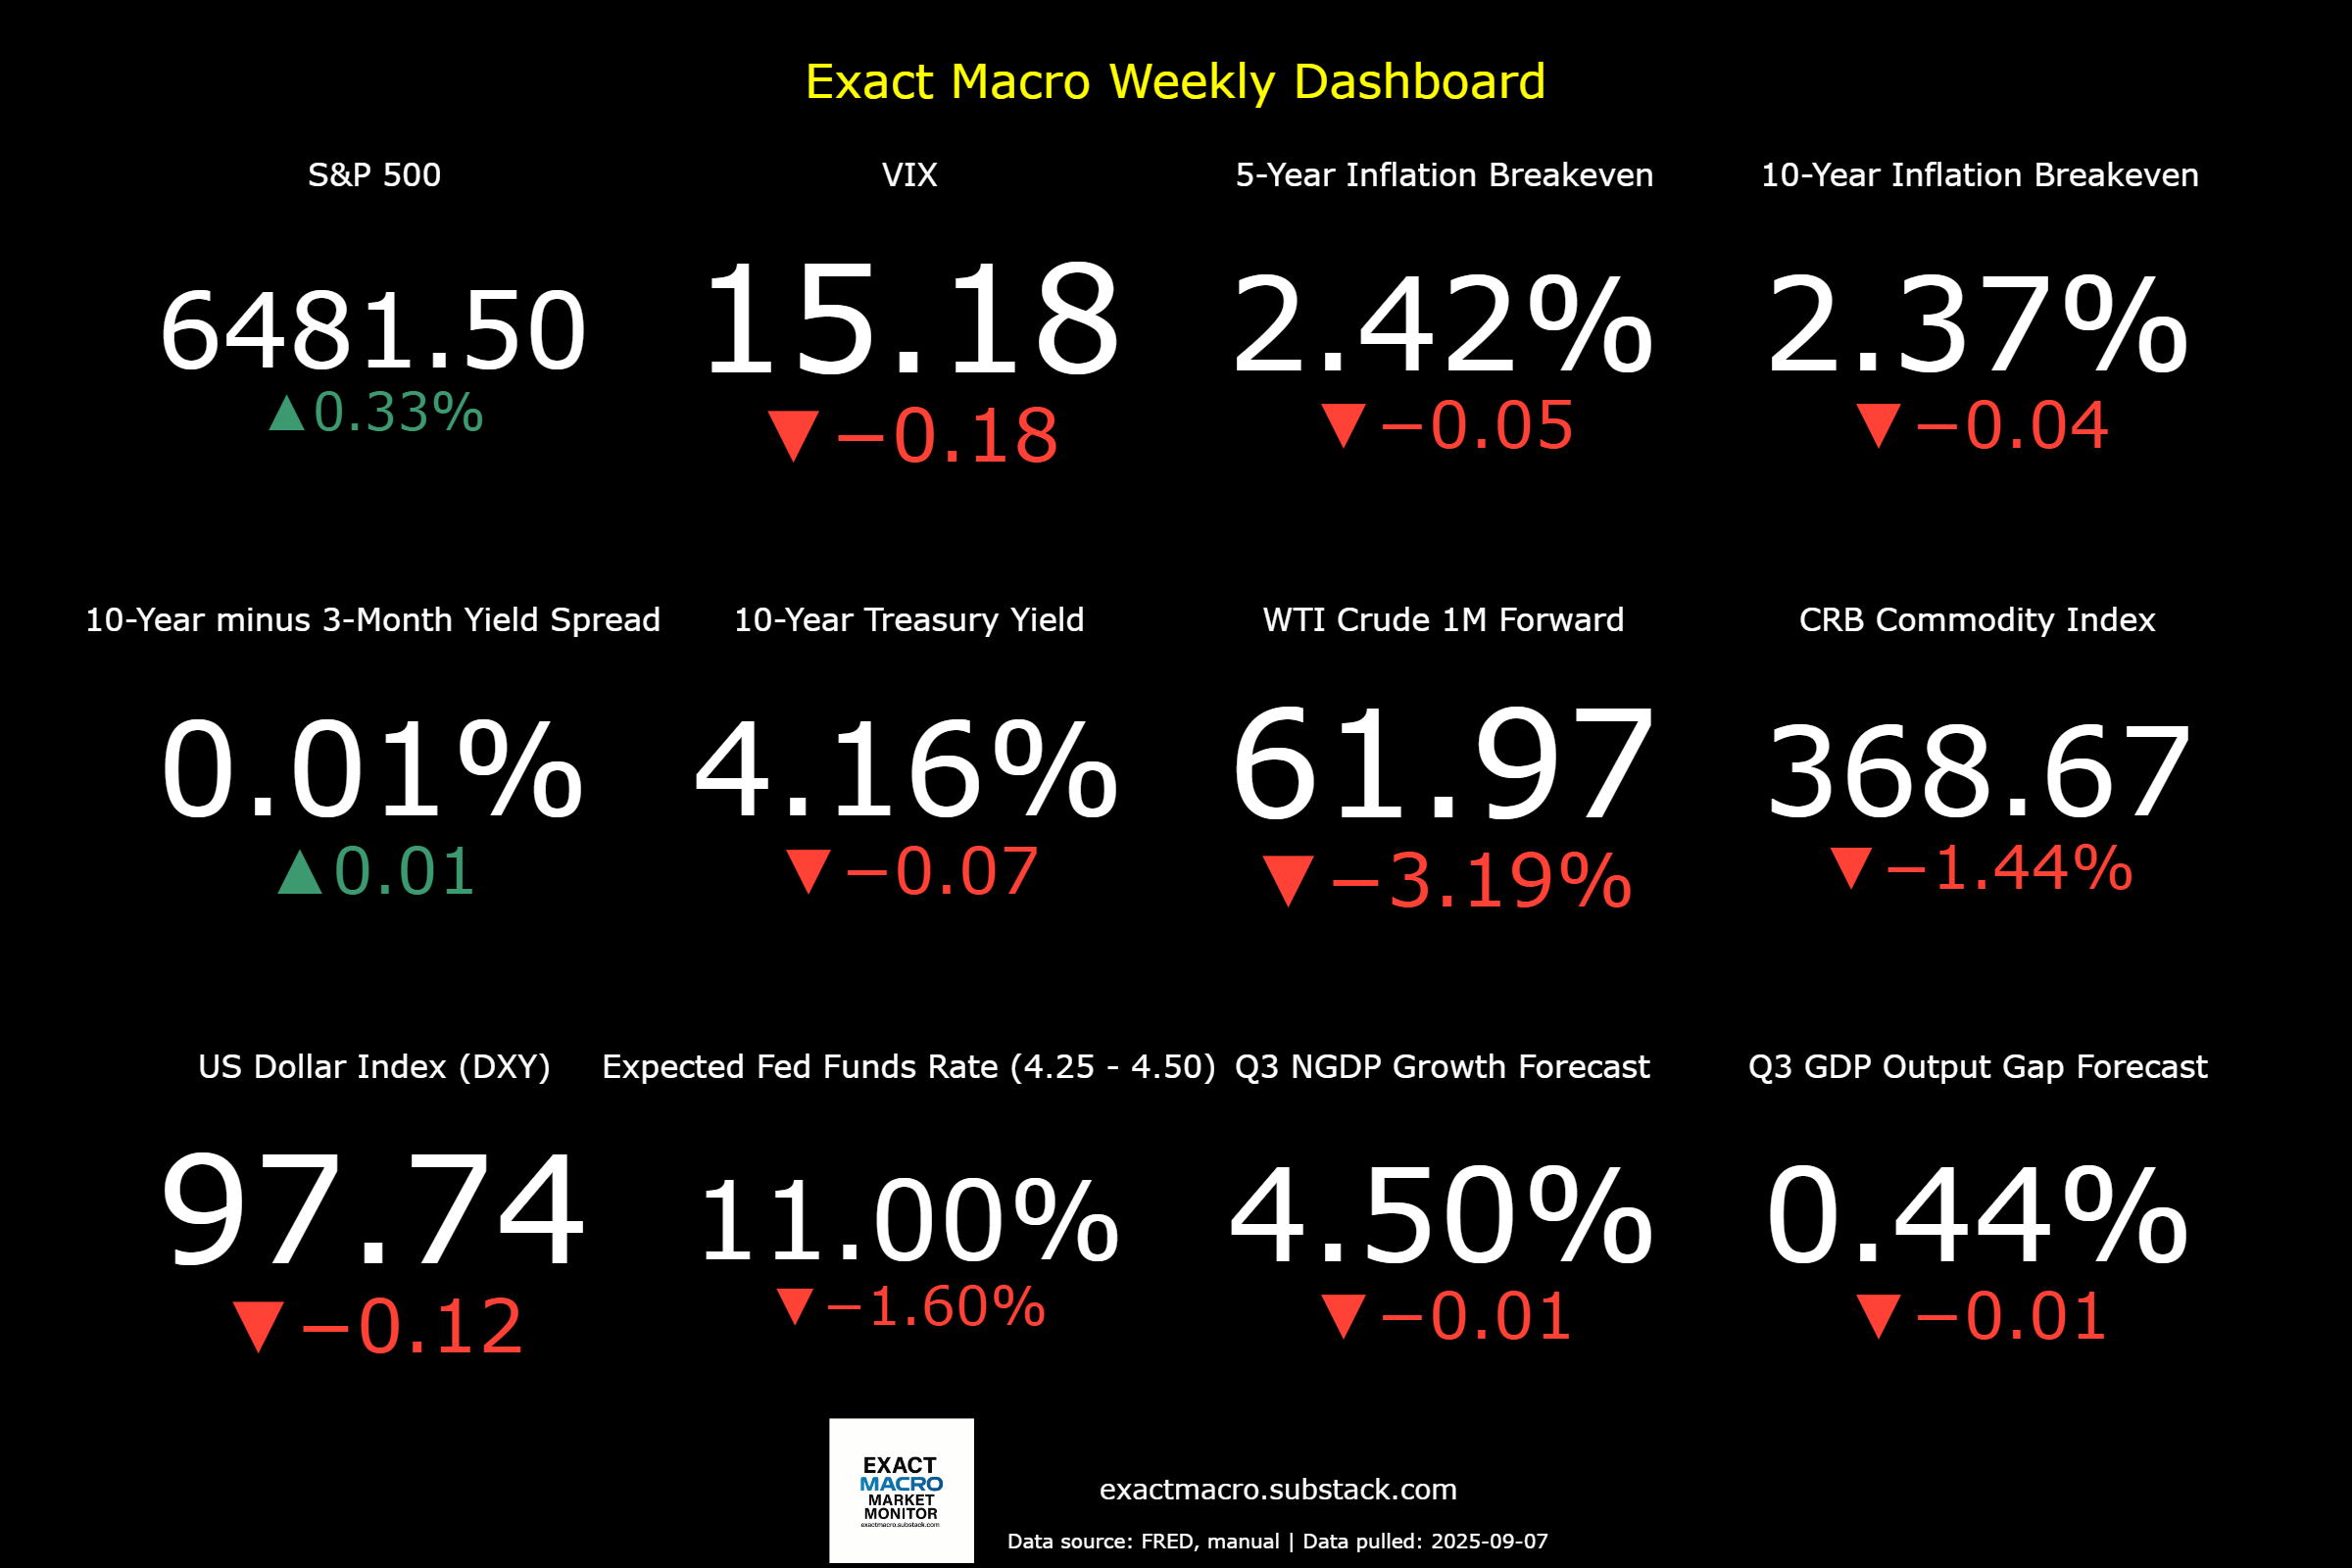
Stock prices and the mean expected NGDP growth rate rose last week, despite a weaker-than-expected jobs report that brought prices down Friday. While the report showed job growth of only 22,000 in August, the June number was revised downward to a loss of 13,000 jobs, which was the first report with a negative value since the pandemic. Inflation expectations fell slightly, but remain near the Fed’s 2% target in core PCE terms, likely continuing to limit stock price gains. The latest Q3 market-based NGDP forecast barely changed.
The quarterly market-based NGDP forecasts extend to the end of 2026. Looking beyond 2026, the Fed Funds futures market suggests the economy is expected to continue to weaken through at least Q1 of 2027, with a very slow recovery to follow and that might not be complete even by mid-2030.
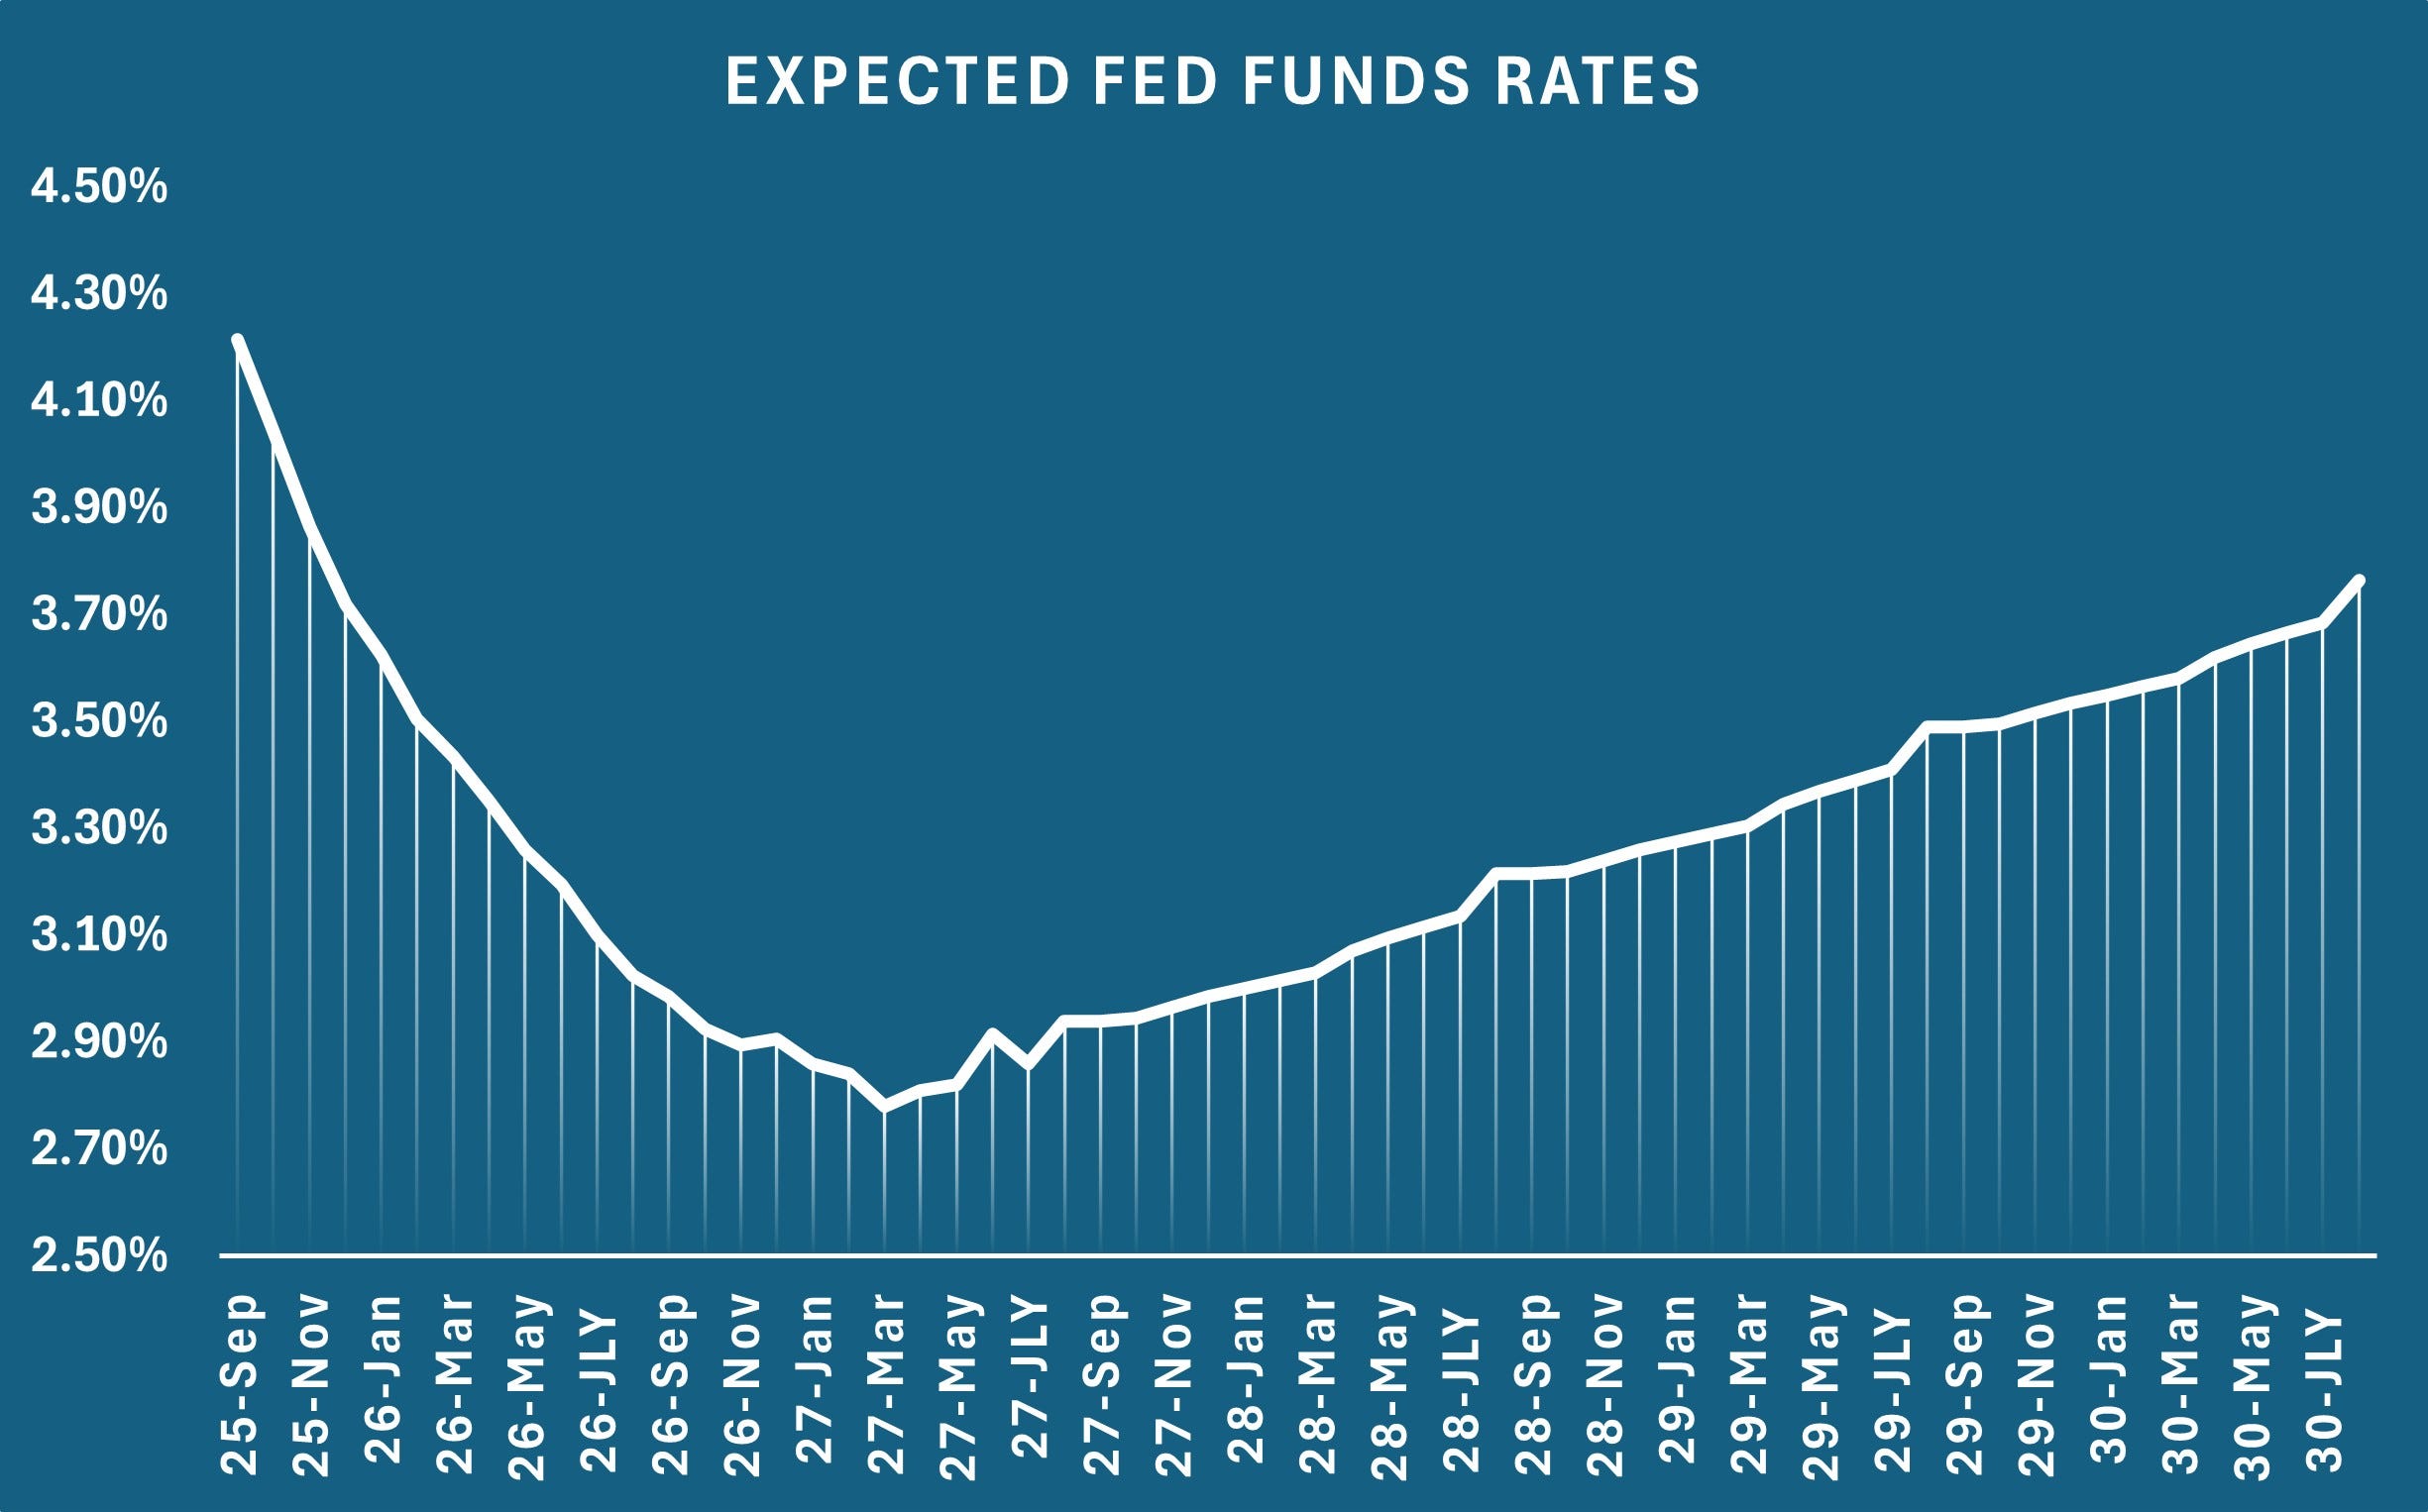
The lower expected future rates could also reflect lower real growth expectations, due to trade and immigration restrictions, and higher commodity prices, along with a loss in international tourism.
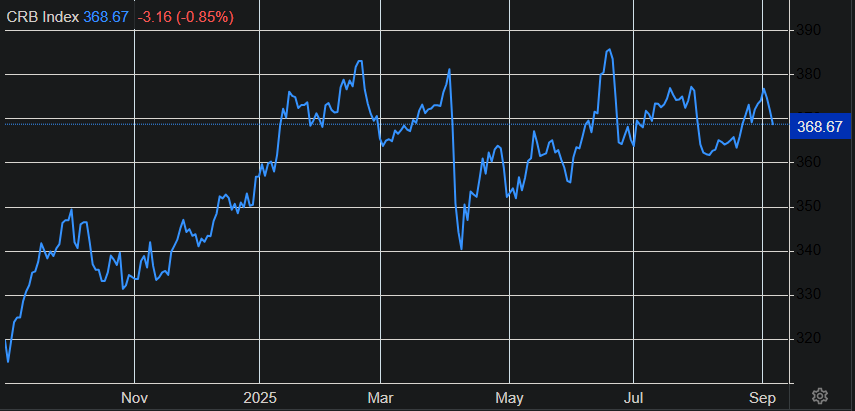
Commodity prices have been elevated since Trump won election in November, likely reflecting a combination of weather-related supply constraints in agriculture, geopolitical conflicts in the Middle East, and the effects of Trump policies including a weakened dollar and supply chain disruptions due to the vast and sloppy tariff policies.
The seemingly rapidly changing real GDP growth potential is one reason I abandoned my estimated real GDP potential as a baseline for market-based NGDP growth forecasts, having recently shifted to the mean NGDP growth rate over the past two cycles as the new baseline. The losses in potential have likely been offset somewhat by investment in and expected boosts in real growth due to AI technology.
As I’ve stated previously, while current LLM technology is wildly over-hyped by some, with AGI nowhere on the foreseeable horizon, it is none the less quite powerful. It represents a universal translator function, connected to a vast probabilistic database of its training and huge information throughput, and further grounded by much of the current internet via internet search. While incapable of true independent logical processing, it benefits from logic inherent in the nature of its semantic network, due in part to the structure of human language and in part some higher order pattern matching. Properly scaffolded with prompting and deterministic technology such as Python libraries for mathematical calculations and robust data validation procedures, along with clever uses of context windows for continuous improvement, they can automate many tasks in ways that are not immediately obvious to the causal user.
While many hot takes followed the recent MIT report that over 90% of companies had failed to profit from top-down attempts to adopt LLM technology, the reality is far more nuanced. The failure rate is much lower for companies that hired outside vendors to integrate the technology, and back office operations tend to benefit more than those of customer service and sales, in which even seemingly successful integration might raise the unexpected ire of customers. Also, unofficial bottom-up use of the technology, sometimes against company policy, represents potential shadow gains in productivity.
The message here is that many try to integrate this technology without the appropriate understanding of how it works, including its capabilities and limitations. I am a heavy user of this technology, on both customer-facing chatbots and backend APIs, and I can tell you that learning I’ve done to understand the technology has greatly increased my appreciation of its limitaitons, but also its capabilities. It is much more of a productivity booster, like a power tool, than a job replacer. This is a productivity revolution that I will have more to write about in the near future.
Note: This post, as is the case with all my posts, should not be construed as offering investment advice. Such advice should be tailored to the individual investor by qualified professionals who, ideally, are fiduciaries.
Links to Data:
Economic Data Sources:
https://fred.stlouisfed.org/series/SP500
https://www.wsj.com/market-data/stocks/peyields
https://www.barchart.com/futures/quotes/ES*0/futures-prices
https://ycharts.com/indicators/sp_500_earnings_per_share_forward_estimate#:~:text=Basic%20Info-,S&P%20500%20Earnings%20Per%20Share%20Forward%20Estimate%20is%20at%20a,28.27%25%20from%20one%20year%20ago.
https://www.cnbc.com/quotes/.VIX
https://fred.stlouisfed.org/series/DTWEXBGS
https://fred.stlouisfed.org/graph/?g=Ee9i
https://fred.stlouisfed.org/series/T10Y3M#0
https://fred.stlouisfed.org/series/DGS10
https://www.cmegroup.com/trading/interest-rates/countdown-to-fomc.html
https://tradingeconomics.com/commodity/crb?user=nunote
https://www.cnbc.com/quotes/@CL.1
https://www.cmegroup.com/trading/en
https://www.spglobal.com/spdji/en/documents/additional-material/sp-500-eps-est.xlsx
https://www.cmegroup.com/markets/interest-rates/stirs/30-day-federal-fund.quotes.html