


Stock and GDP Outlook, for Week Ending 08/18/2023
Tracking the GDP Output Gap

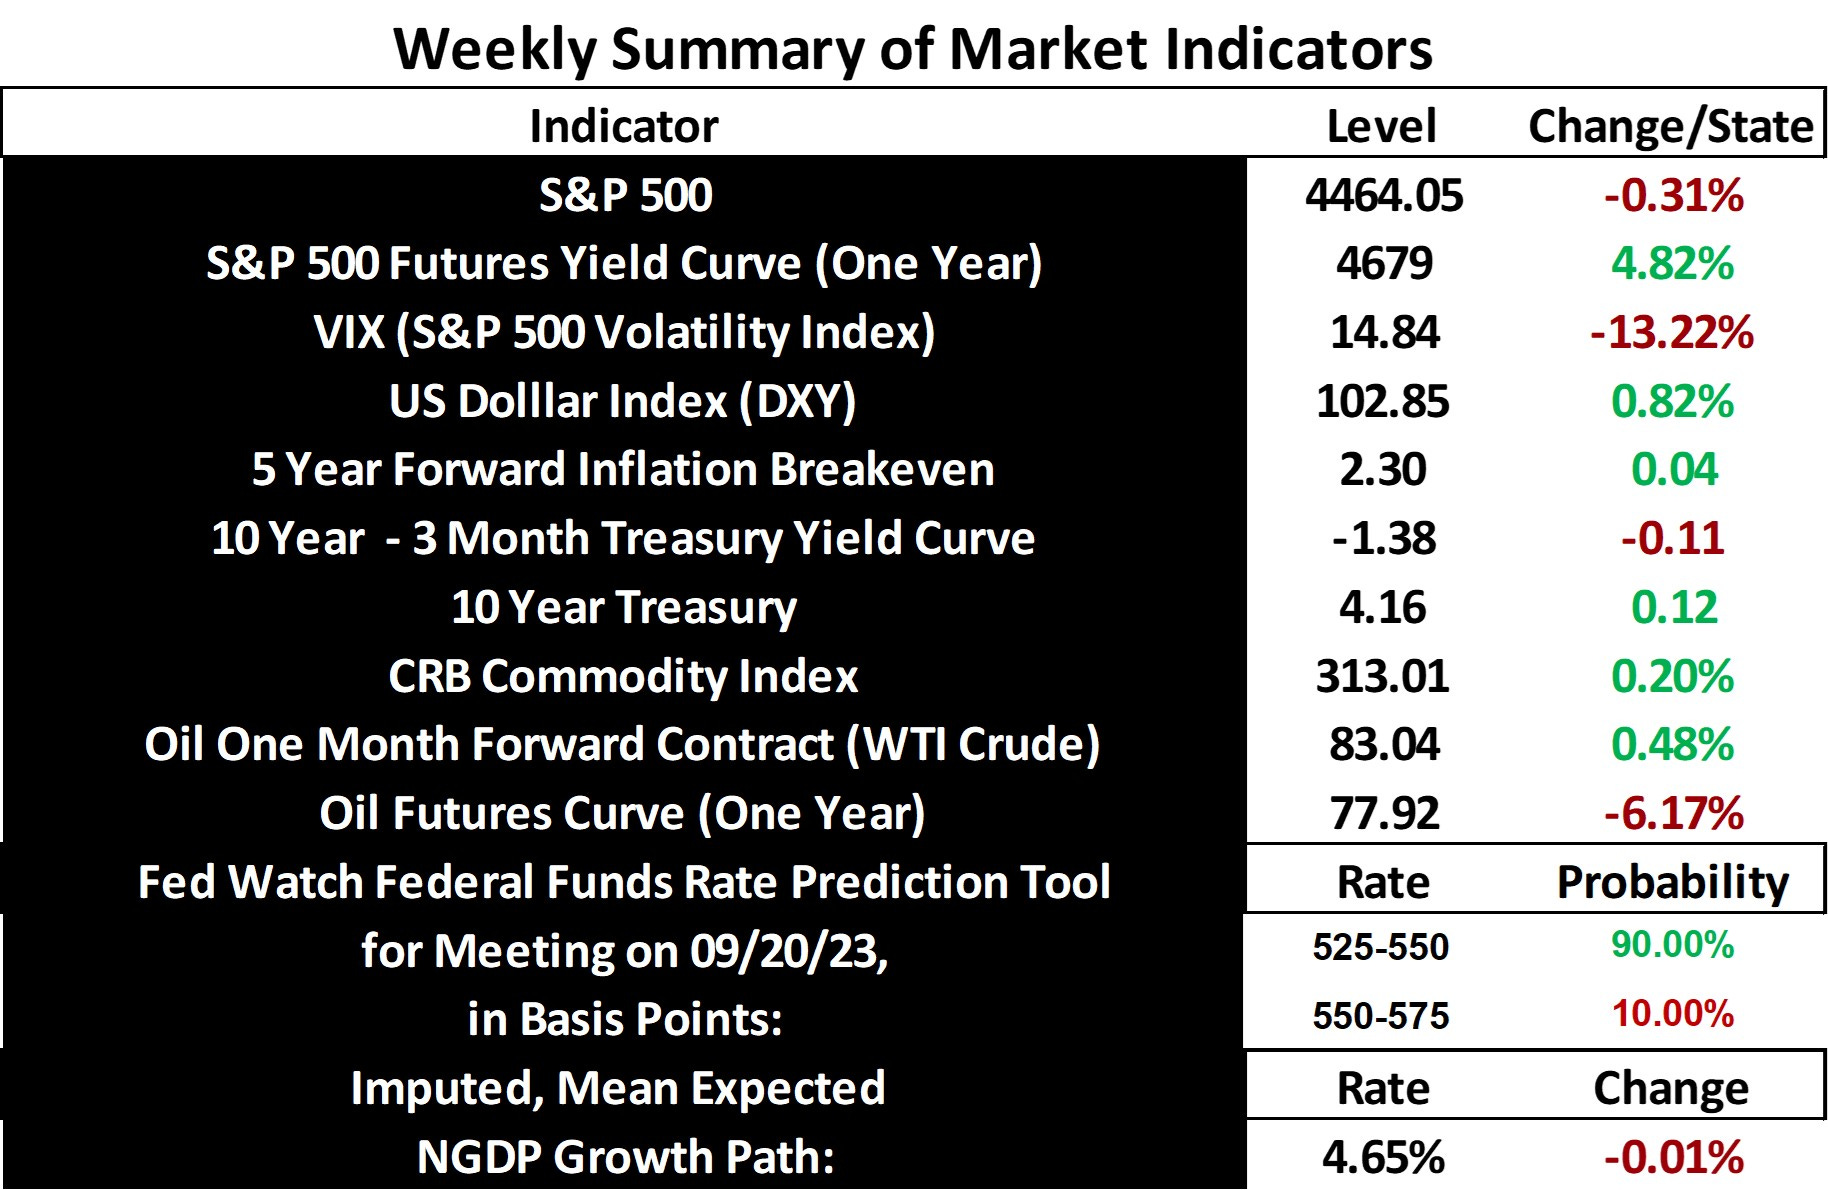
The S&P 500 and mean expected NGDP growth rate fell for the second week in a row, though only slighltly, as the expected inflation rate creeped yet closer to 2%, in core PCE terms. The 10 year Treasury yield also continued its climb, helping further flatten the still quite inverted Treasury yield curve. Overall, the outlook versus the prior week hasn’t changed much. There’s still much reason for optimism regarding a soft landing.
Consistent with the expanded discussion of recent weeks, I thought I might provide yet more context concerning the models that inform the perspectives expressed on this blog, and how it relates to the current economic outlook. I’ve discussed the relationship between mean NGDP growth and the mean S&P 500 earnings yield. That is, that they are equal in the long run and that divergences can be interpreted as episodes of macro disequilibrium. This is consistent with the principle that the return on capital should equal the economic growth rate, in the long run, on average. Given this claim, it should be straightforward to calculate GDP output gaps, at least in past data. So, I’ll focus on that point for the remainder of this post.
First, I should say, that for much of the historical data, this approach to calculating output gaps is not very useful, at least in terms of anything like precision estimates. For example, in the below chart, it is obvious that the imputed output gaps, calculated using the difference between NGDP growth and the S&P 500 earnings yield (using concurrent, rather than trailing 12 month earnings), are pretty unrealistic until getting to about the year 1996. This is due to the extremely high earnings yields going back to the Great Inflation, driven by a combination of both high inflation and expected inflation, and the implications of tax bracket creep.
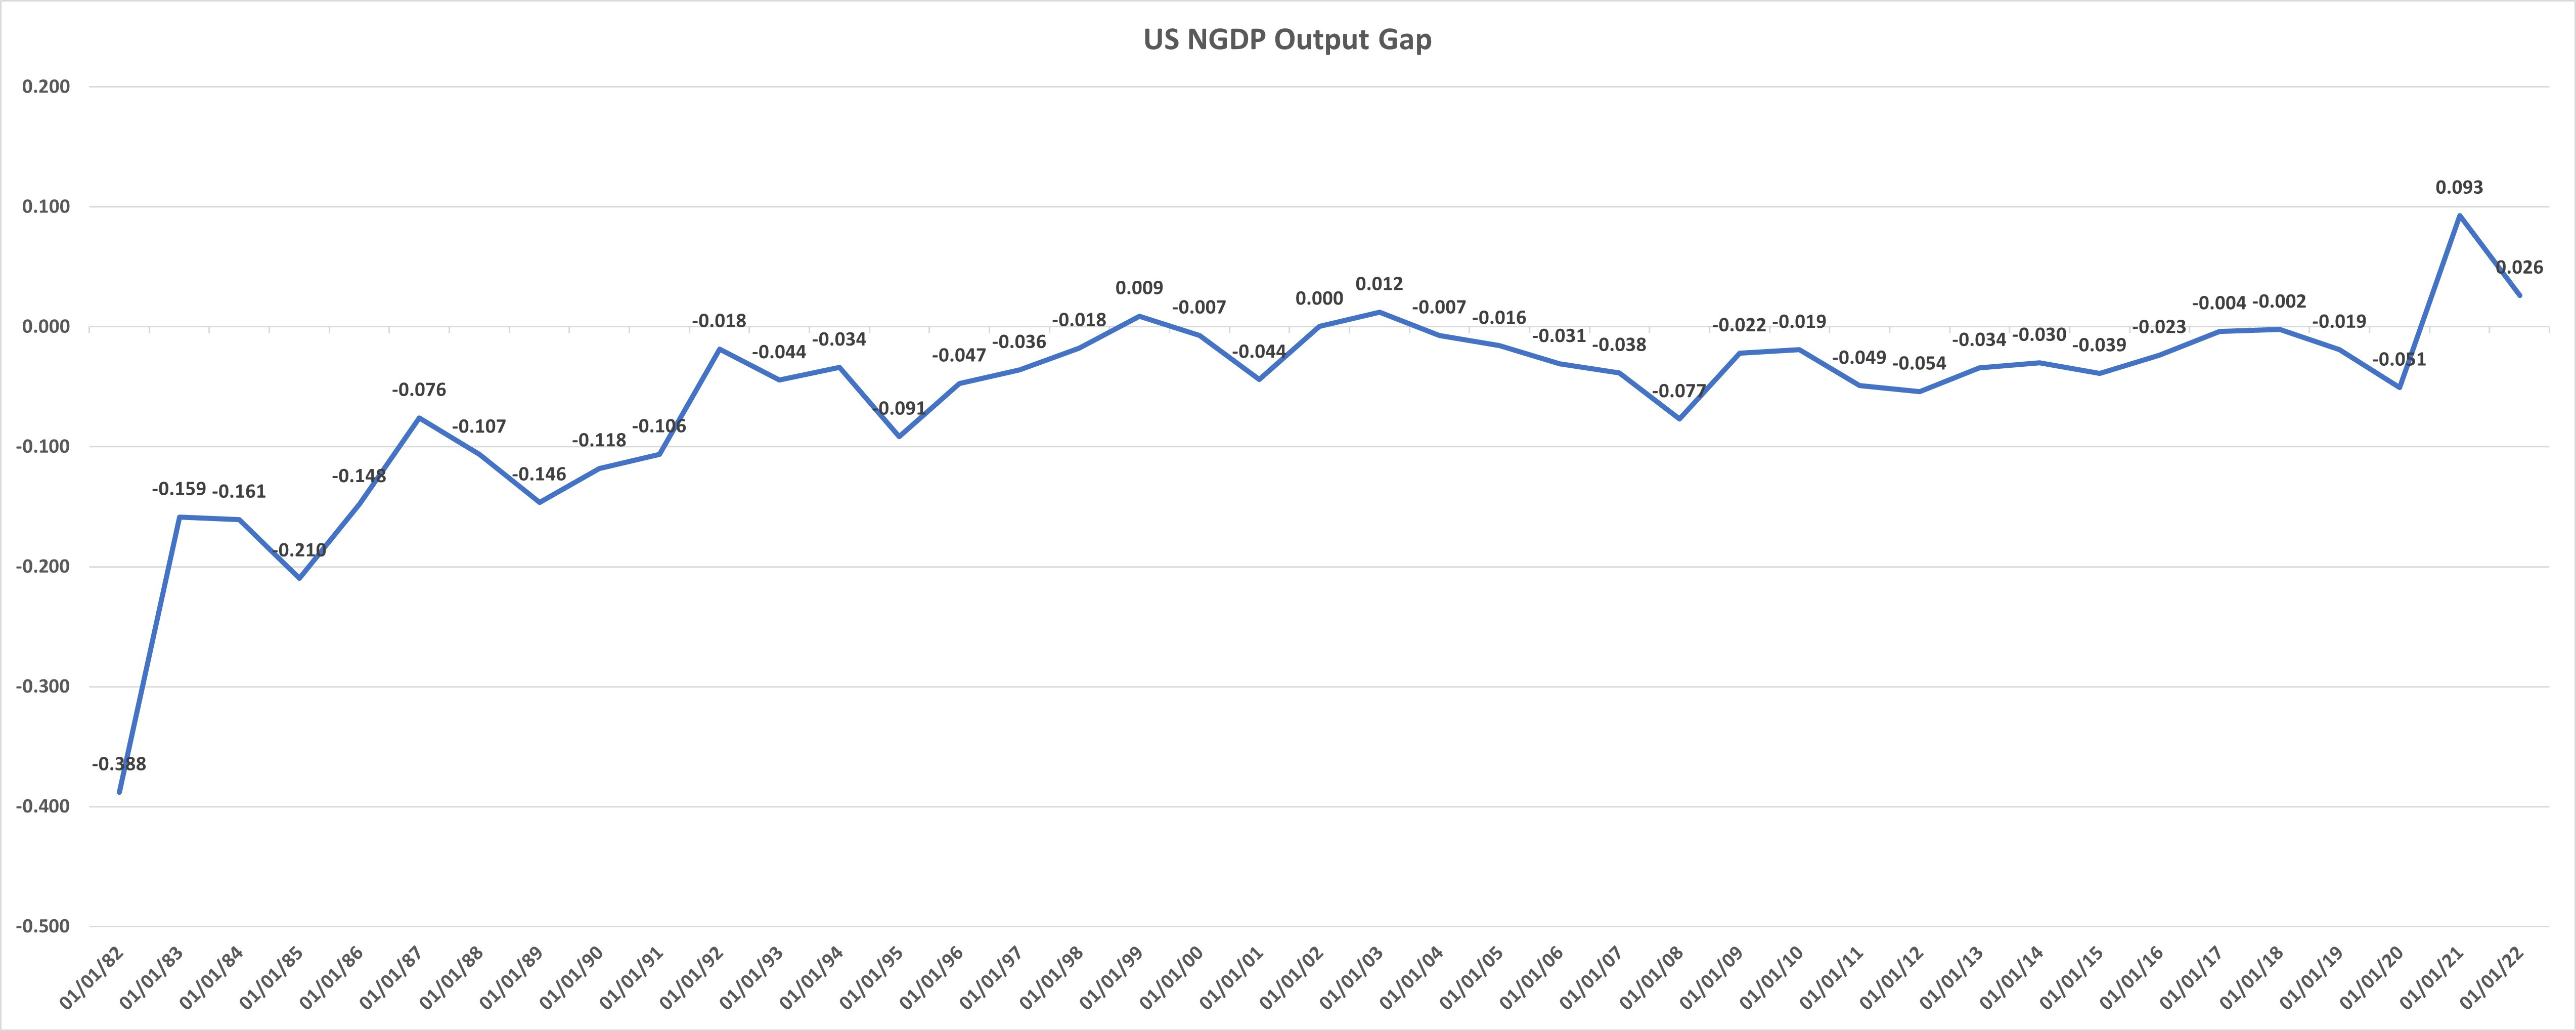
This approach to measuring the output gap didn’t fair as badly in the 60s as in the 70s and 80s, but in all other prior periods for which I have data, the approach simply doesn’t work. I suspect this is due to the fact that in those prior periods the US was on various permutations of the gold standard, but I’ve not studied the question thoroughly.
Zooming in on more recent data, however, we see imputed output gaps that look quite plausible:
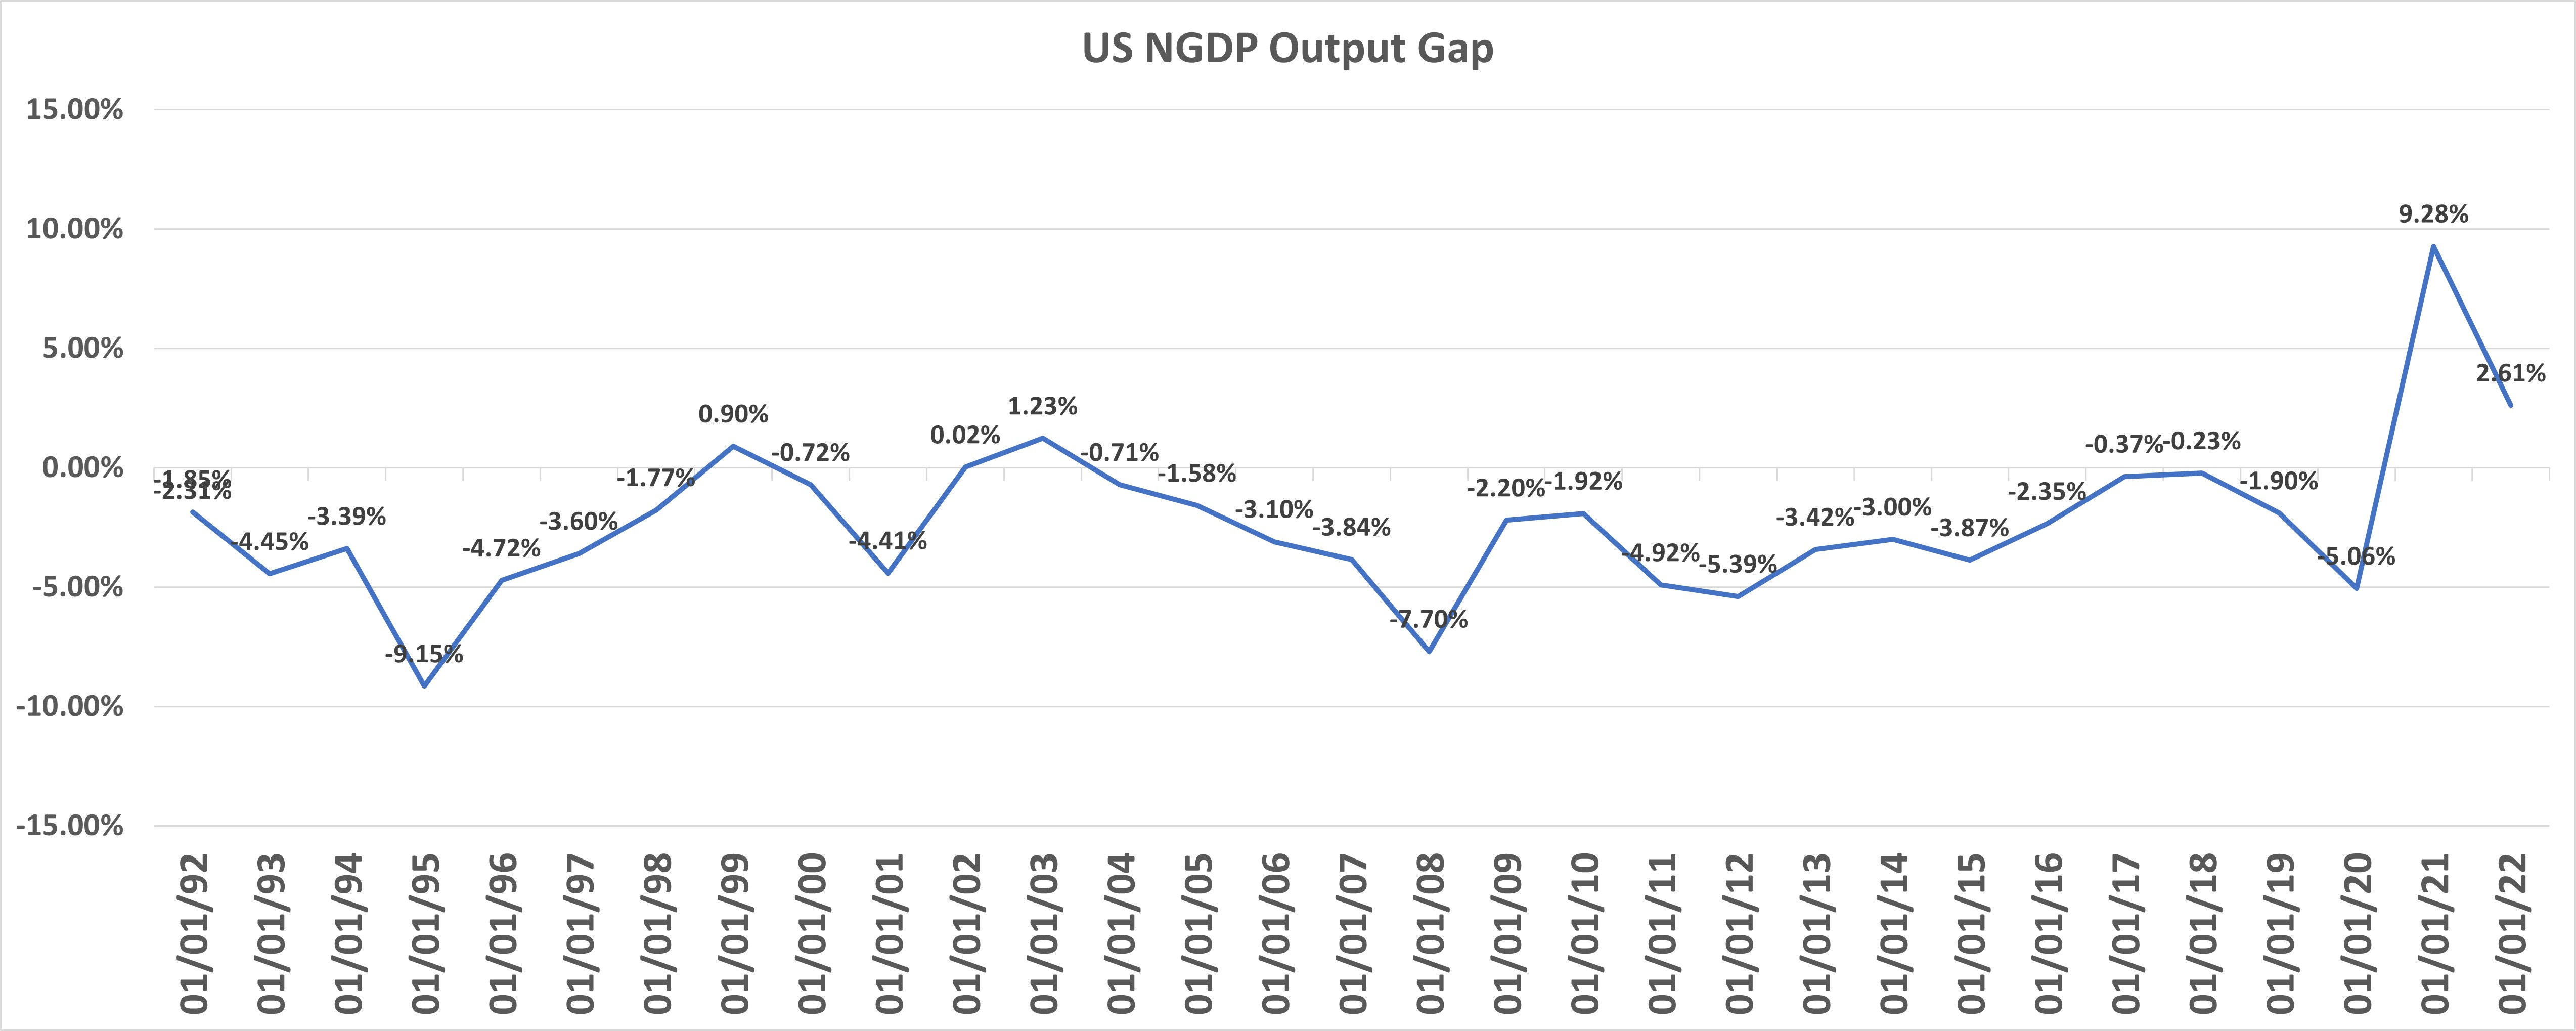
The closer to the 2000s the data gets, the more realistic is seems.
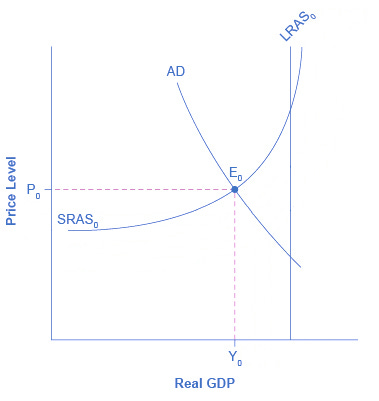
This data, to the degree taken seriously, is consistent with other evidence I’ve discussed regarding output gaps. Let’s take my claim, for example, that the US economy never reached equilibrium between the last two recessions. The above data shows that it came fairly close in 2017 and 2018, and inflation started to rise in 2018, though inflation expectations remained tame, before Fed tightening. I claimed in the past that, according to the SRAS/LRAS/AD model, we should expect inflation to temporarily rise as output approaches potential. Perhaps this is due to a need for lower real wages to clear the labor market as less productive workers are hired(comments welcome)?
I also claimed that the economy was pushed further below potential by the Fed tightening that began in 2018, which is consistent with subsequent fallen inflation rates and inflation expectations, which were well-below target in 2019, especially in core PCE terms.

And naturally, employment growth slowed.

Now, for the data closer to the present, and more germaine to the current outlook, here is the most recent such output gap data:
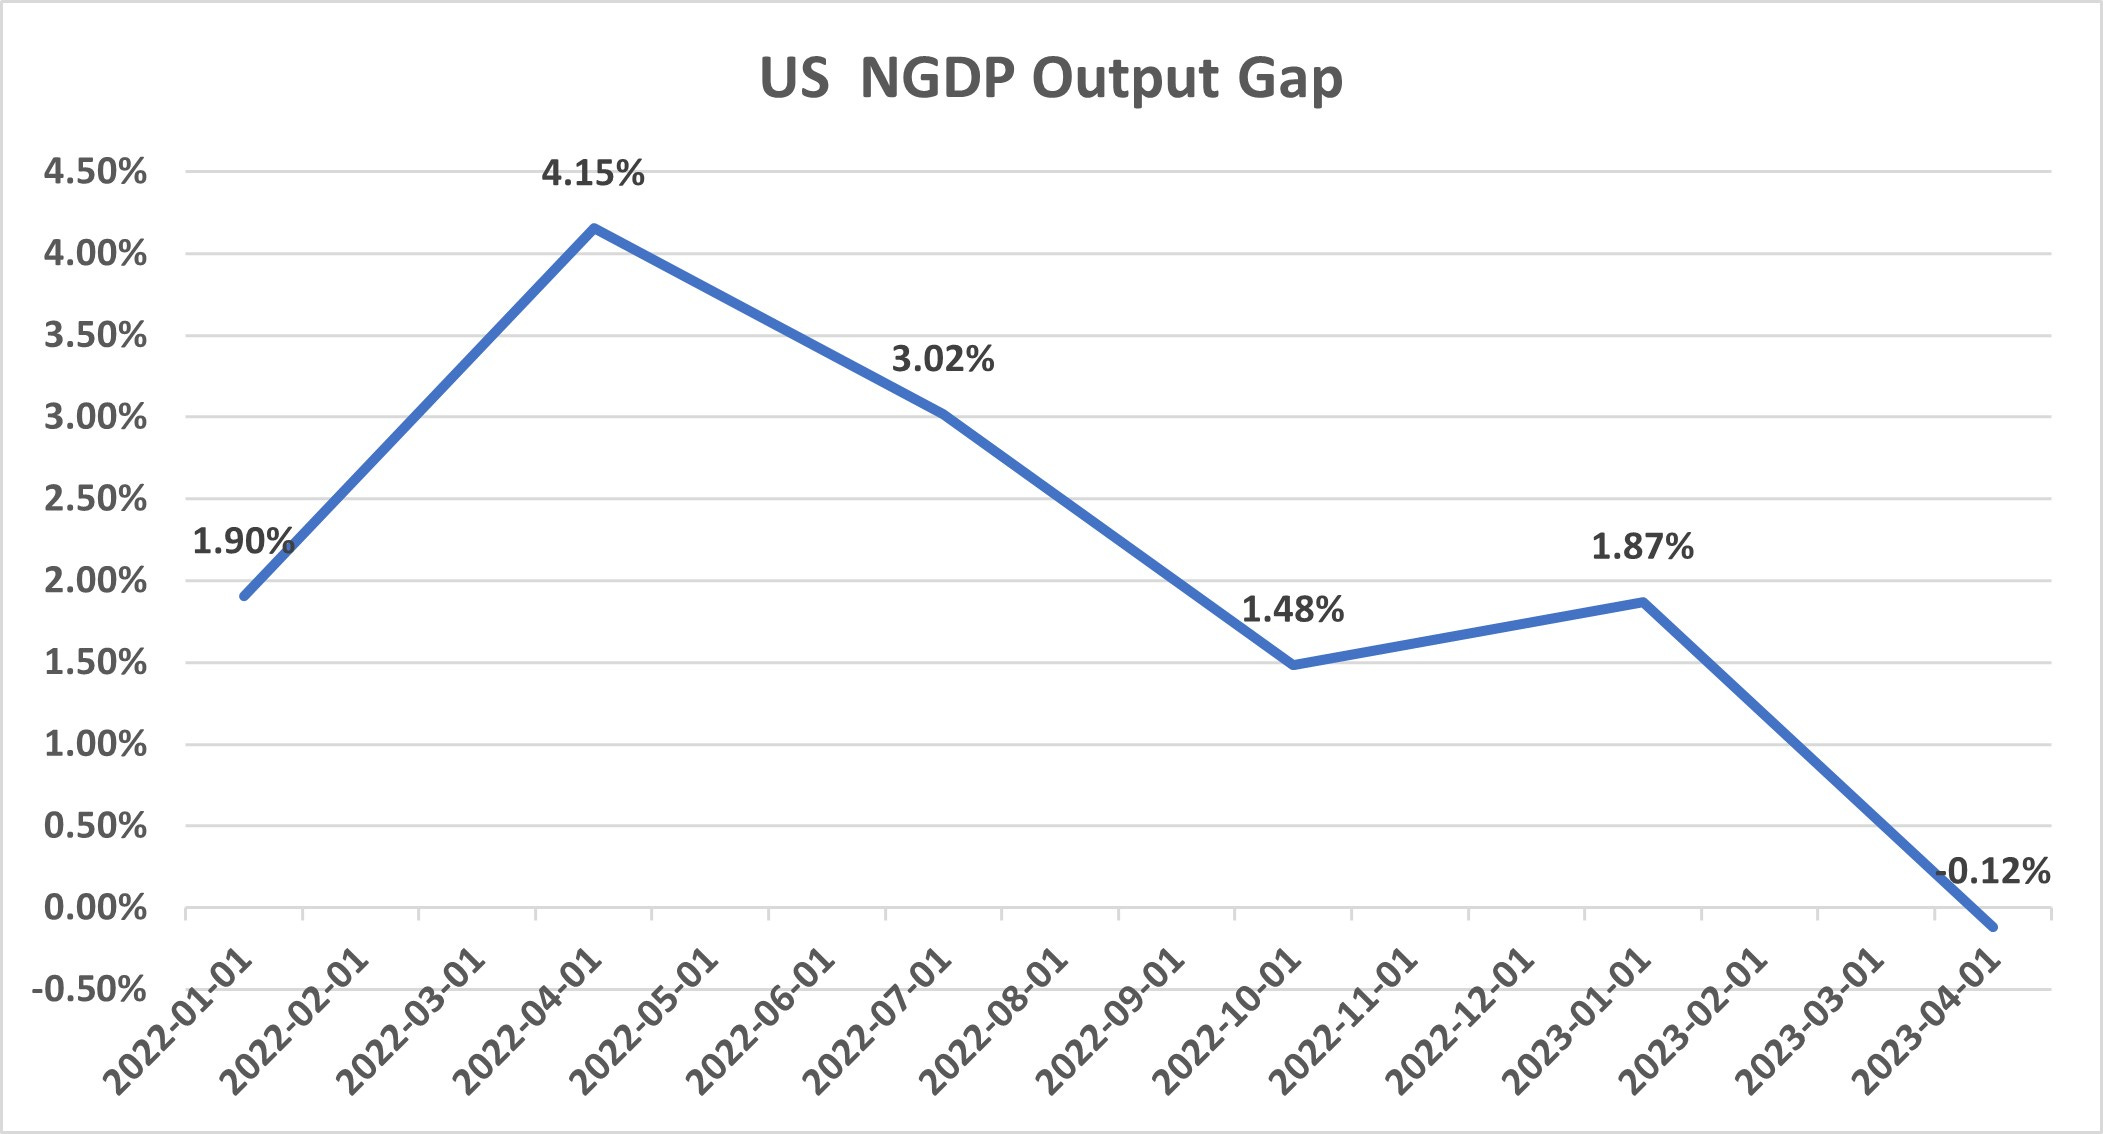
That most recent Q1 2023 data point is negative, in case it’s difficult to read.
So, by this measure, the economy was near equilibrium by the end of Q1. This means that not a lot more stock price appreciation would be expected, sans a rise in inflation expectations, some real shocks, or both. Given the projected Q2 S&P 500 annualized earnings figure calculated last week, which was $181.63, and using the Q2 annualized percent change in NGDP, growth was about half-a-percent above potential at the end of Q2.
Comments or questions, as always, are welcome.
Note: This post, as is the case with all my posts, should not be construed as offering investment advice. Such advice should be tailored to the individual investor by qualified professionals who, ideally, are fiduciaries.
Links to Data: