
Stock and GDP Outlook, for Week Ending 08/22/2025
Correcting My Big Mistake

Note: This week’s market outlook post will be different again, with both some good and bad news concerning the announcements in last week’s post, which was met with silence. I will again begin with the outlook, followed by an update on the Treasury yields = mean NGDP growth forecasts claim. I should state here however that the strong, broad versions of the claims made are not supported by evidence, but in fact are very much contradited by it. Hence, a correction follows, though there is still quite strong evidence for a limited equilibrium relationship between Treasury yields and NGDP growth rates.
Outlook:
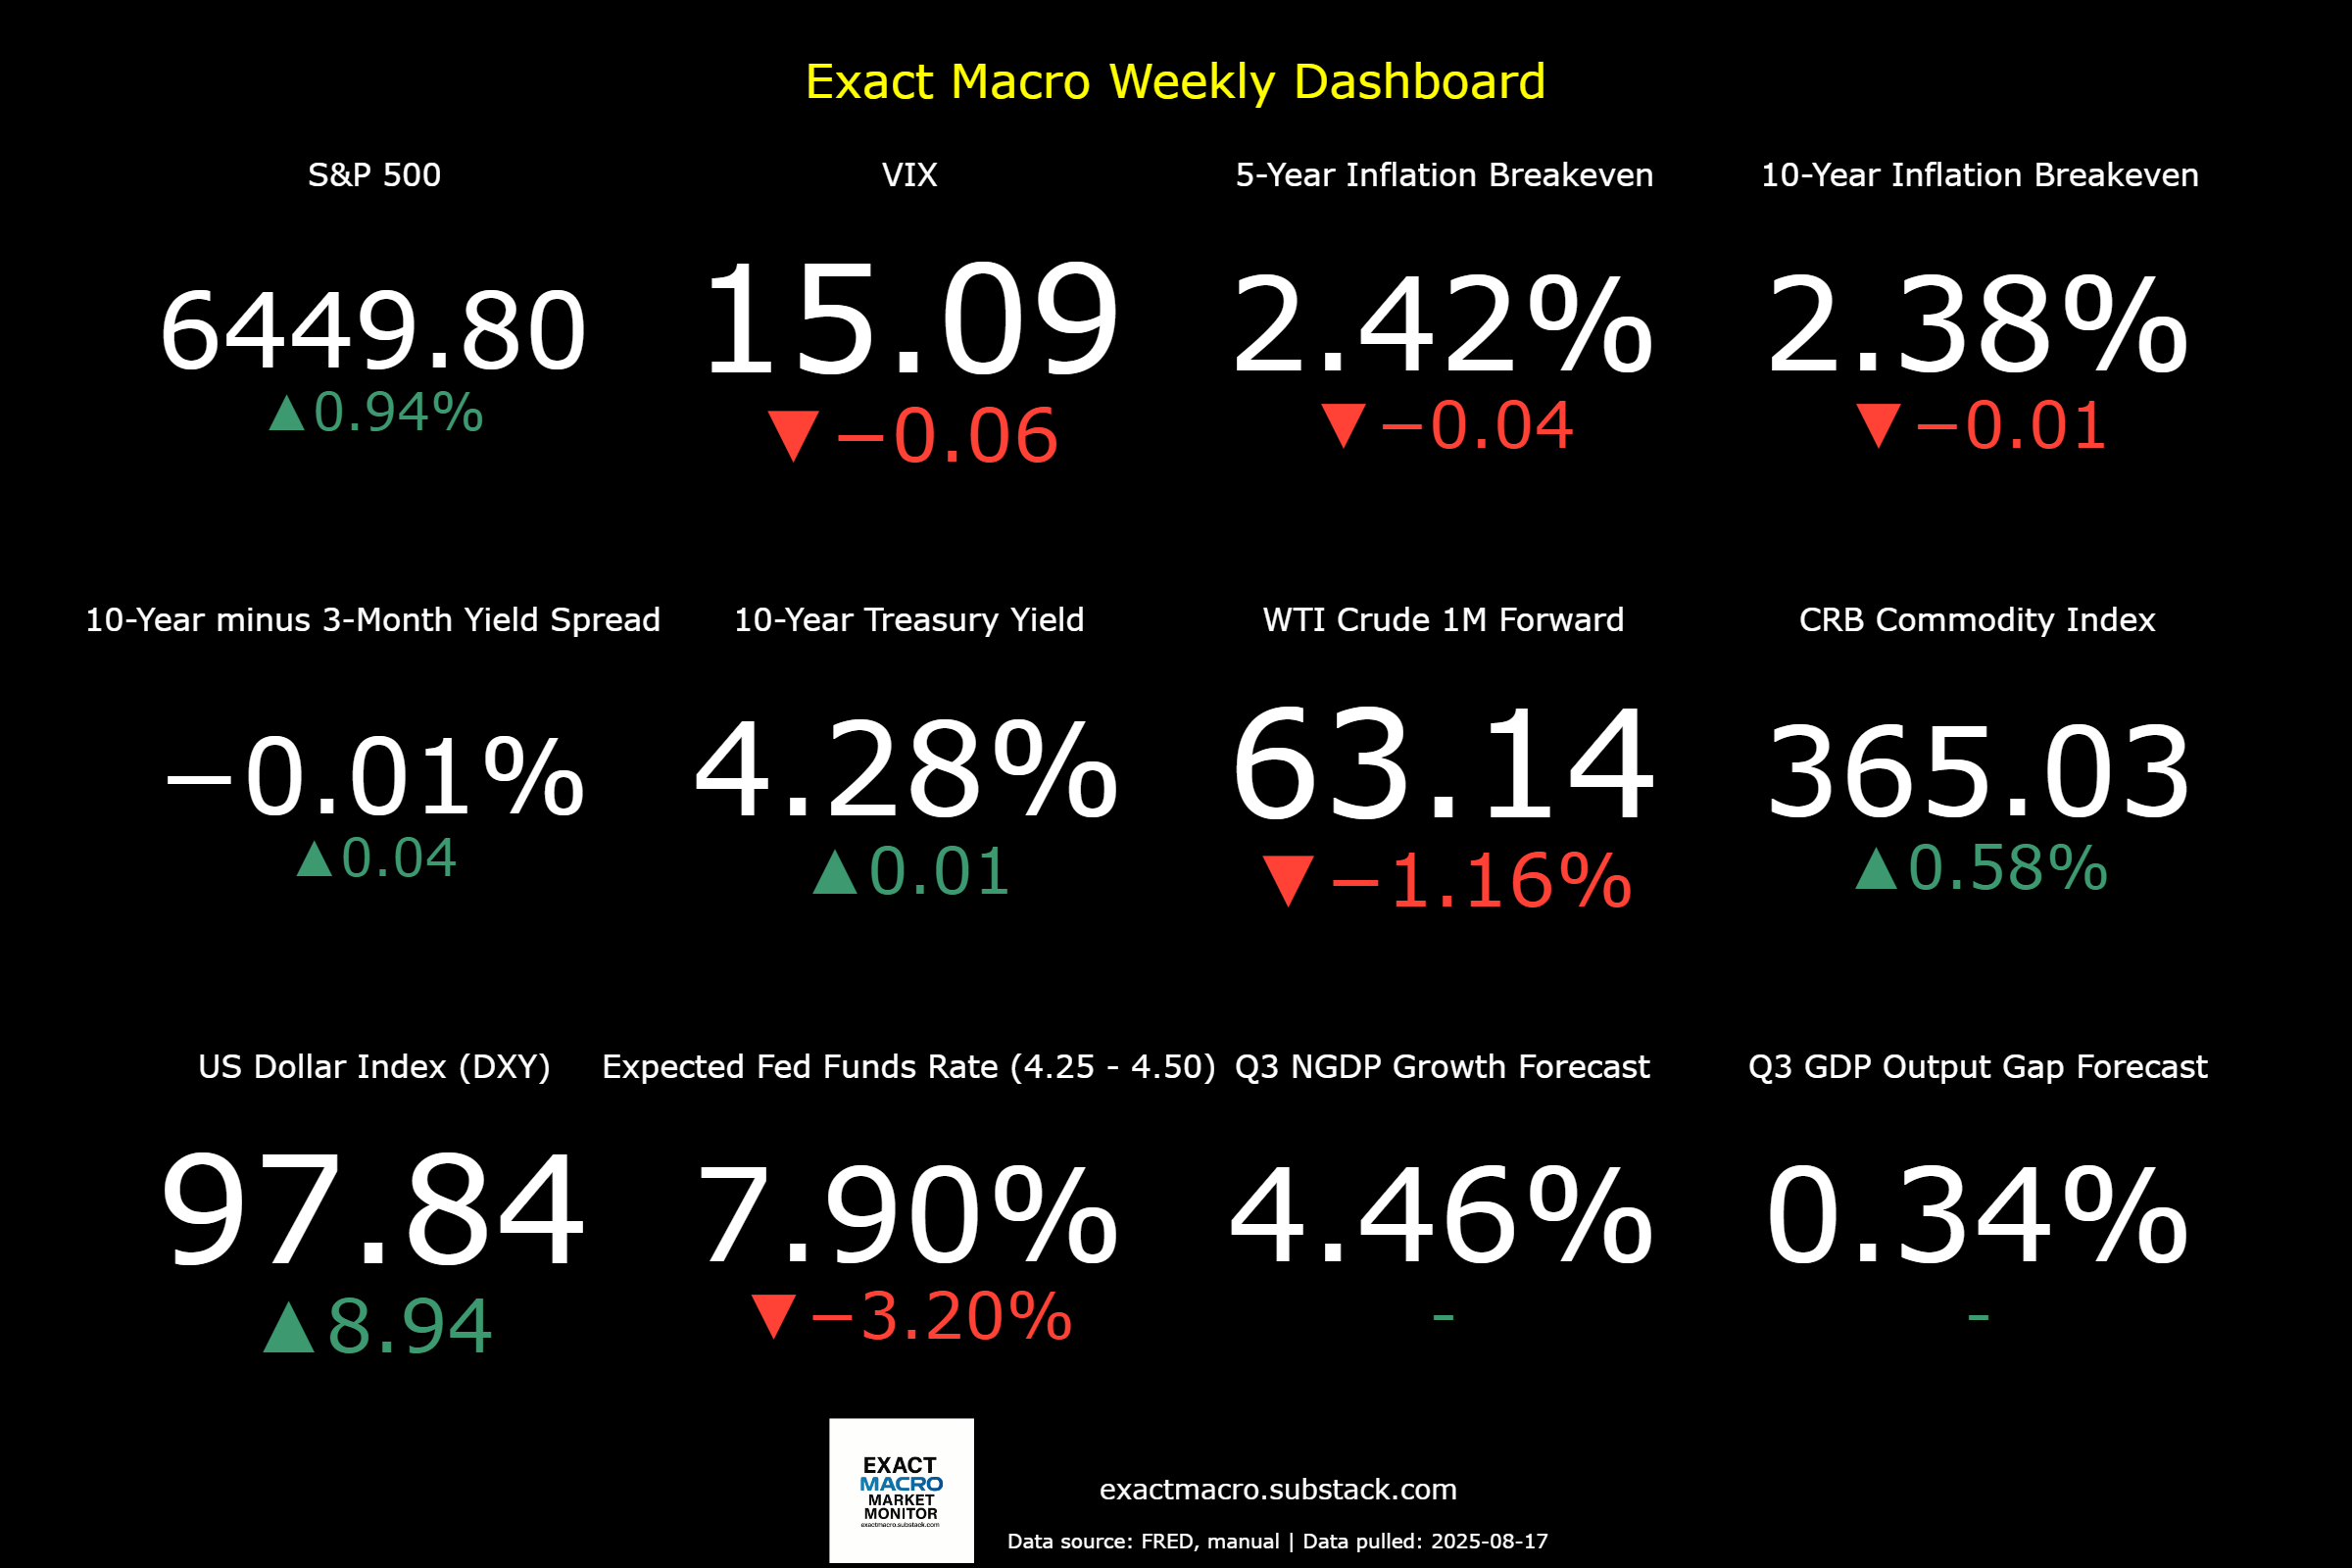
Stock prices and the mean expected NGDP growth rate rose in real terms last week, as inflation expectations slightly eased despite a higher YoY core CPI print and a much larger-than-expected PPI increase. These price pressures were likely driven primarily by new tariffs. Nonetheless, Trump has indicated that updates to tariff rates on steel and semiconductors will be announced in the coming weeks, with further increases expected.
More broadly, concern is mounting over government intervention in the economy, and in individual businesses, in particular. Examples include Trump’s sudden pressure on Coca-Cola to replace high-fructose corn syrup with cane sugar, selective export restrictions on Nvidia and AMD, and the floated possibility of a federal ownership stake in Intel. This mix of crony capitalism, arbitrary product demands, and selective interventionist policies is historically unusual in the U.S. Exceptions appear to be “negotiated” through channels that provide Trump with financial support, PR opportunities, or new revenue streams. Many who once championed free markets seem willing to accept or even promote such policies.
While the short-term outlook remains little changed, the long-term picture looks increasingly dark. No recession is currently forecast, but risks of serious real shocks remain elevated, along with rising odds of at least mild, temporary stagflation. The duration of this stagflation will hinge on whether Trump settles on coherent tariff policies and how he addresses the resulting inflation, assuming those tariffs survive ongoing court challenges. For now, businesses and markets face what amounts to a tax on certainty.
With inflation expectations still elevated, the Fed has limited room to ease further, and next month’s expected rate cuts are already priced in. Absent a positive real shock, stock prices are likely to post only very modest gains in the near term.
Correction:
I want to begin with an apology for the blind hubris with which I overstated my conclusion regarding Treasury yields and NGDP growth forecasts in last week’s post. I claimed that Treasury yields represent direct market-based forecasts for mean NGDP growth over their maturities. The data shows this is wrong and, in fact, the strong version of that claim is flatly contradicted by evidence. That mistake was driven by over-exuberance and confirmation bias after too quick a glance at the data.
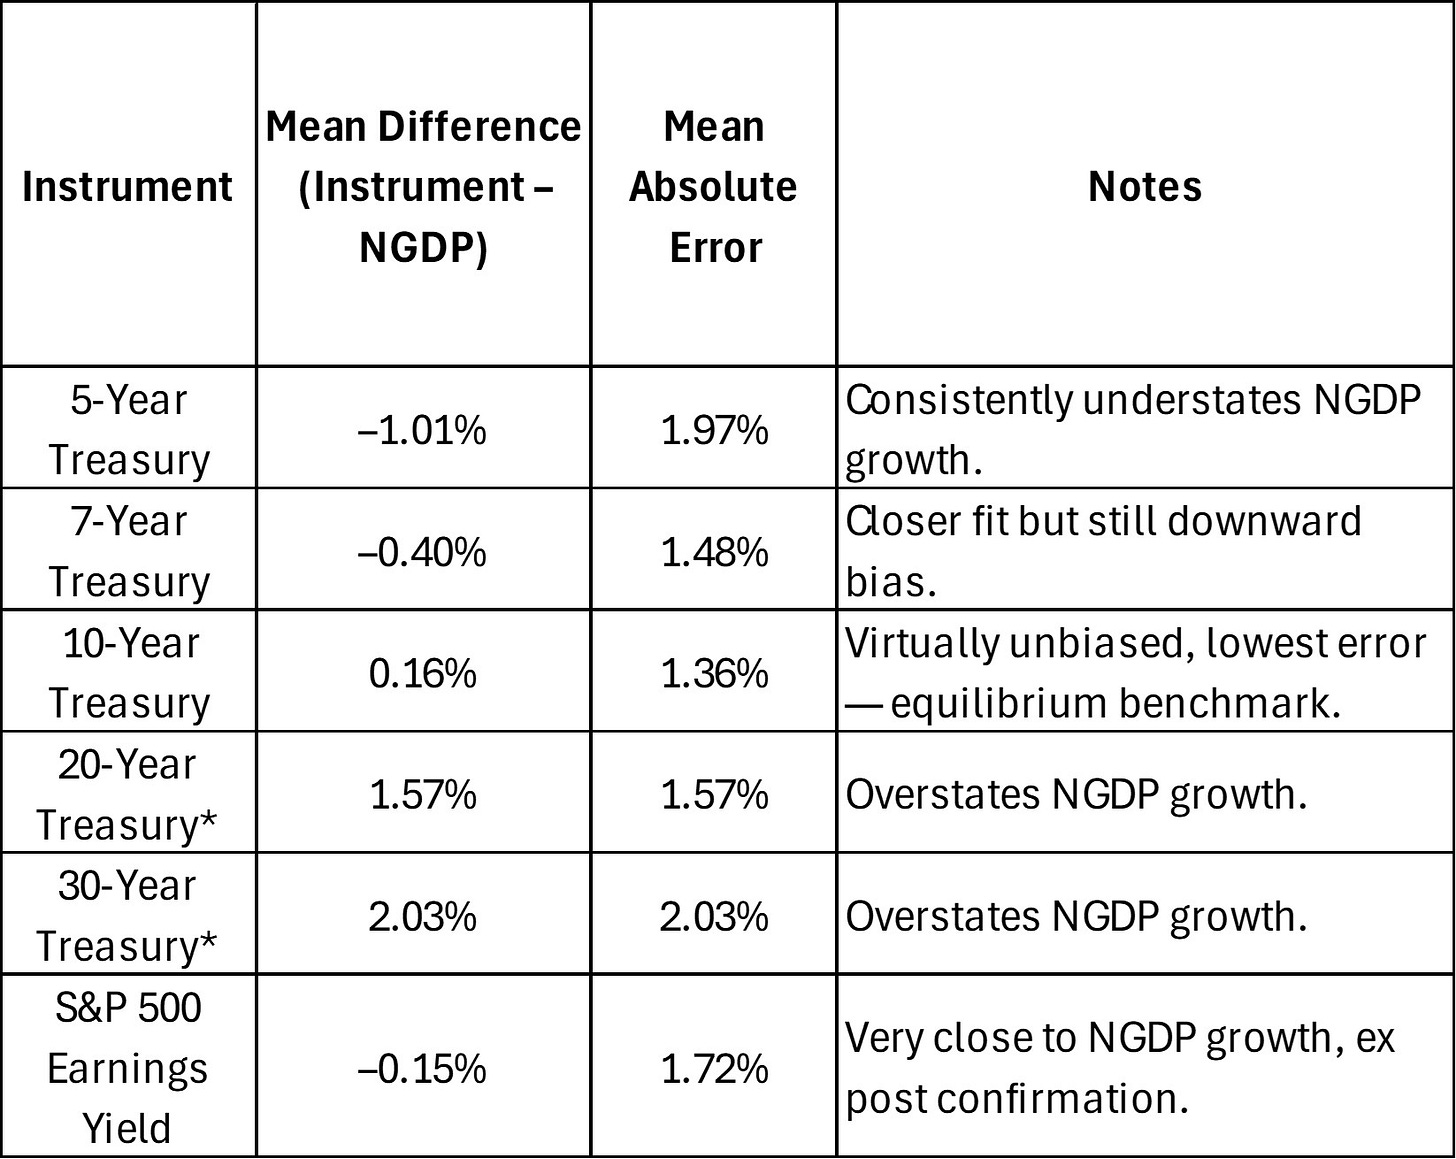
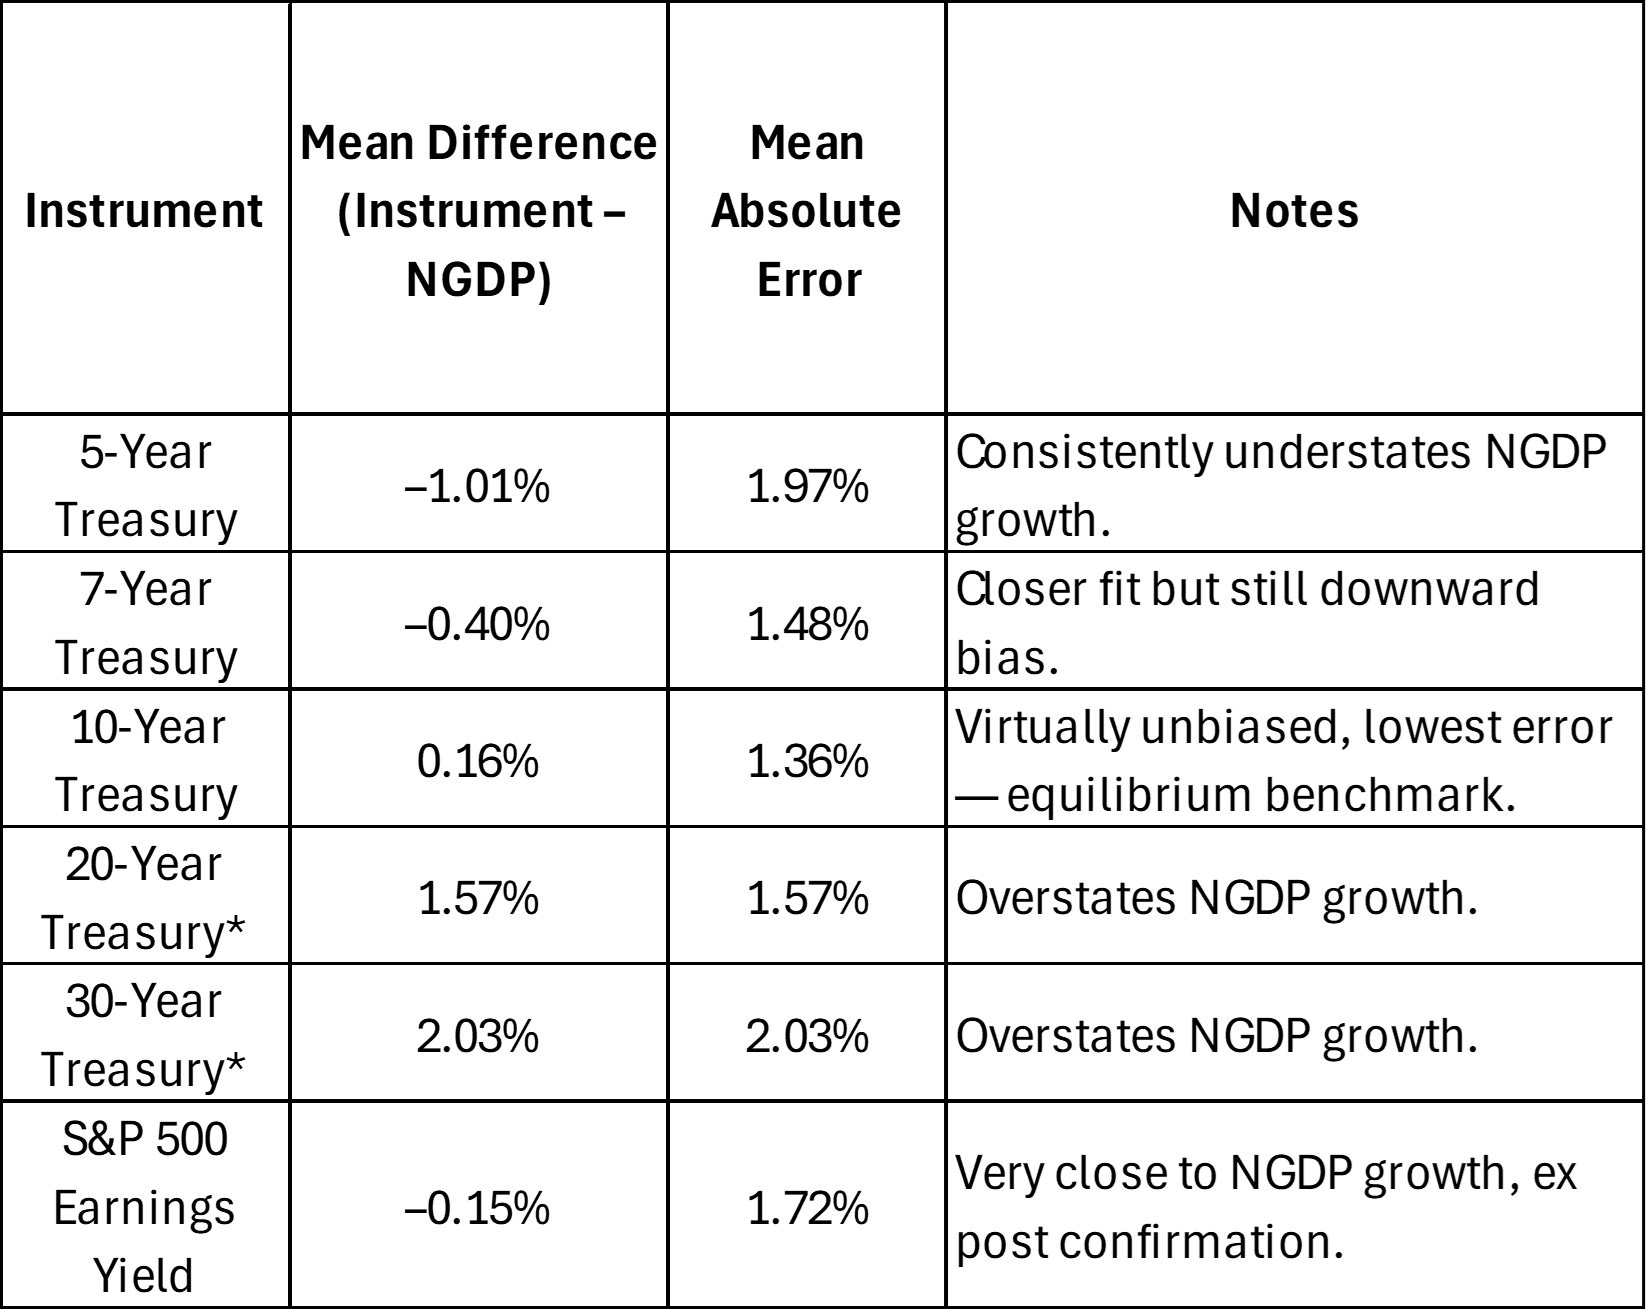
The good news is that when the data is handled carefully, a much narrower but still powerful result emerges. There is robust evidence of an equilibrium relationship between the 10-year Treasury yield and subsequent mean 10-year NGDP growth rates. The evidence holds over the full dataset and across split samples, which reduces the likelihood that the low mean differences are coincidental. By contrast, the 5-year is too noisy, while the 20-year and 30-year are systematically biased (with breaks in their issuance history). Here’s a table with a summary of the data findings:

* The data for 20-year and 30-year rates are only considered for the most recent, unbroken series. All data is from FRED.
Here’s a summary of results since 1990, alongside the S&P 500 earnings yield for comparison:
10-Year Treasury Yield: Mean difference vs. forward NGDP growth ≈ +0.16 percentage points; Mean absolute error ≈ 1.36 percentage points.
S&P 500 Earnings Yield: Mean difference vs. NGDP growth ≈ –0.15 percentage points; Mean absolute error ≈ 1.72 percentage points.
This suggests the 10-year Treasury yield is a genuine equilibrium anchor which is unbiased, relatively precise, and consistent across time.
Coupled with the evidence that the S&P 500 earnings yield also aligns closely with NGDP growth (as expected from classical theory that the return on capital should equal the growth rate of the economy, and the arbitrage condition embedded in the cost-of-carry model for stock index futures), the case for a limited but important equilibrium relationship is strong.
The implication is clear: while Treasuries cannot be read as direct NGDP forecasts under disequilibrium (e.g. during unstable monetary regimes), in equilibrium the 10-Year yield reflects the NGDP growth anchor. That makes it a practical candidate for a market-based method of NGDP level targeting. Targeting the 10-Year yield should, at least in principle, work.
I will update the User Guide accordingly, and I will be more careful going forward not to overstate conclusions.
As always, questions and comments are welcome.
Note: This post, as is the case with all my posts, should not be construed as offering investment advice. Such advice should be tailored to the individual investor by qualified professionals who, ideally, are fiduciaries.
Links to Data:
Economic Data Sources:
https://fred.stlouisfed.org/series/SP500
https://www.wsj.com/market-data/stocks/peyields
https://www.barchart.com/futures/quotes/ES*0/futures-prices
https://ycharts.com/indicators/sp_500_earnings_per_share_forward_estimate#:~:text=Basic%20Info-,S&P%20500%20Earnings%20Per%20Share%20Forward%20Estimate%20is%20at%20a,28.27%25%20from%20one%20year%20ago.
https://www.cnbc.com/quotes/.VIX
https://fred.stlouisfed.org/series/DTWEXBGS
https://fred.stlouisfed.org/graph/?g=Ee9i
https://fred.stlouisfed.org/series/T10Y3M#0
https://fred.stlouisfed.org/series/DGS10
https://www.cmegroup.com/trading/interest-rates/countdown-to-fomc.html
https://tradingeconomics.com/commodity/crb?user=nunote
https://www.cnbc.com/quotes/@CL.1
https://www.cmegroup.com/trading/en
https://www.spglobal.com/spdji/en/documents/additional-material/sp-500-eps-est.xlsx
https://www.cmegroup.com/markets/interest-rates/stirs/30-day-federal-fund.quotes.html