

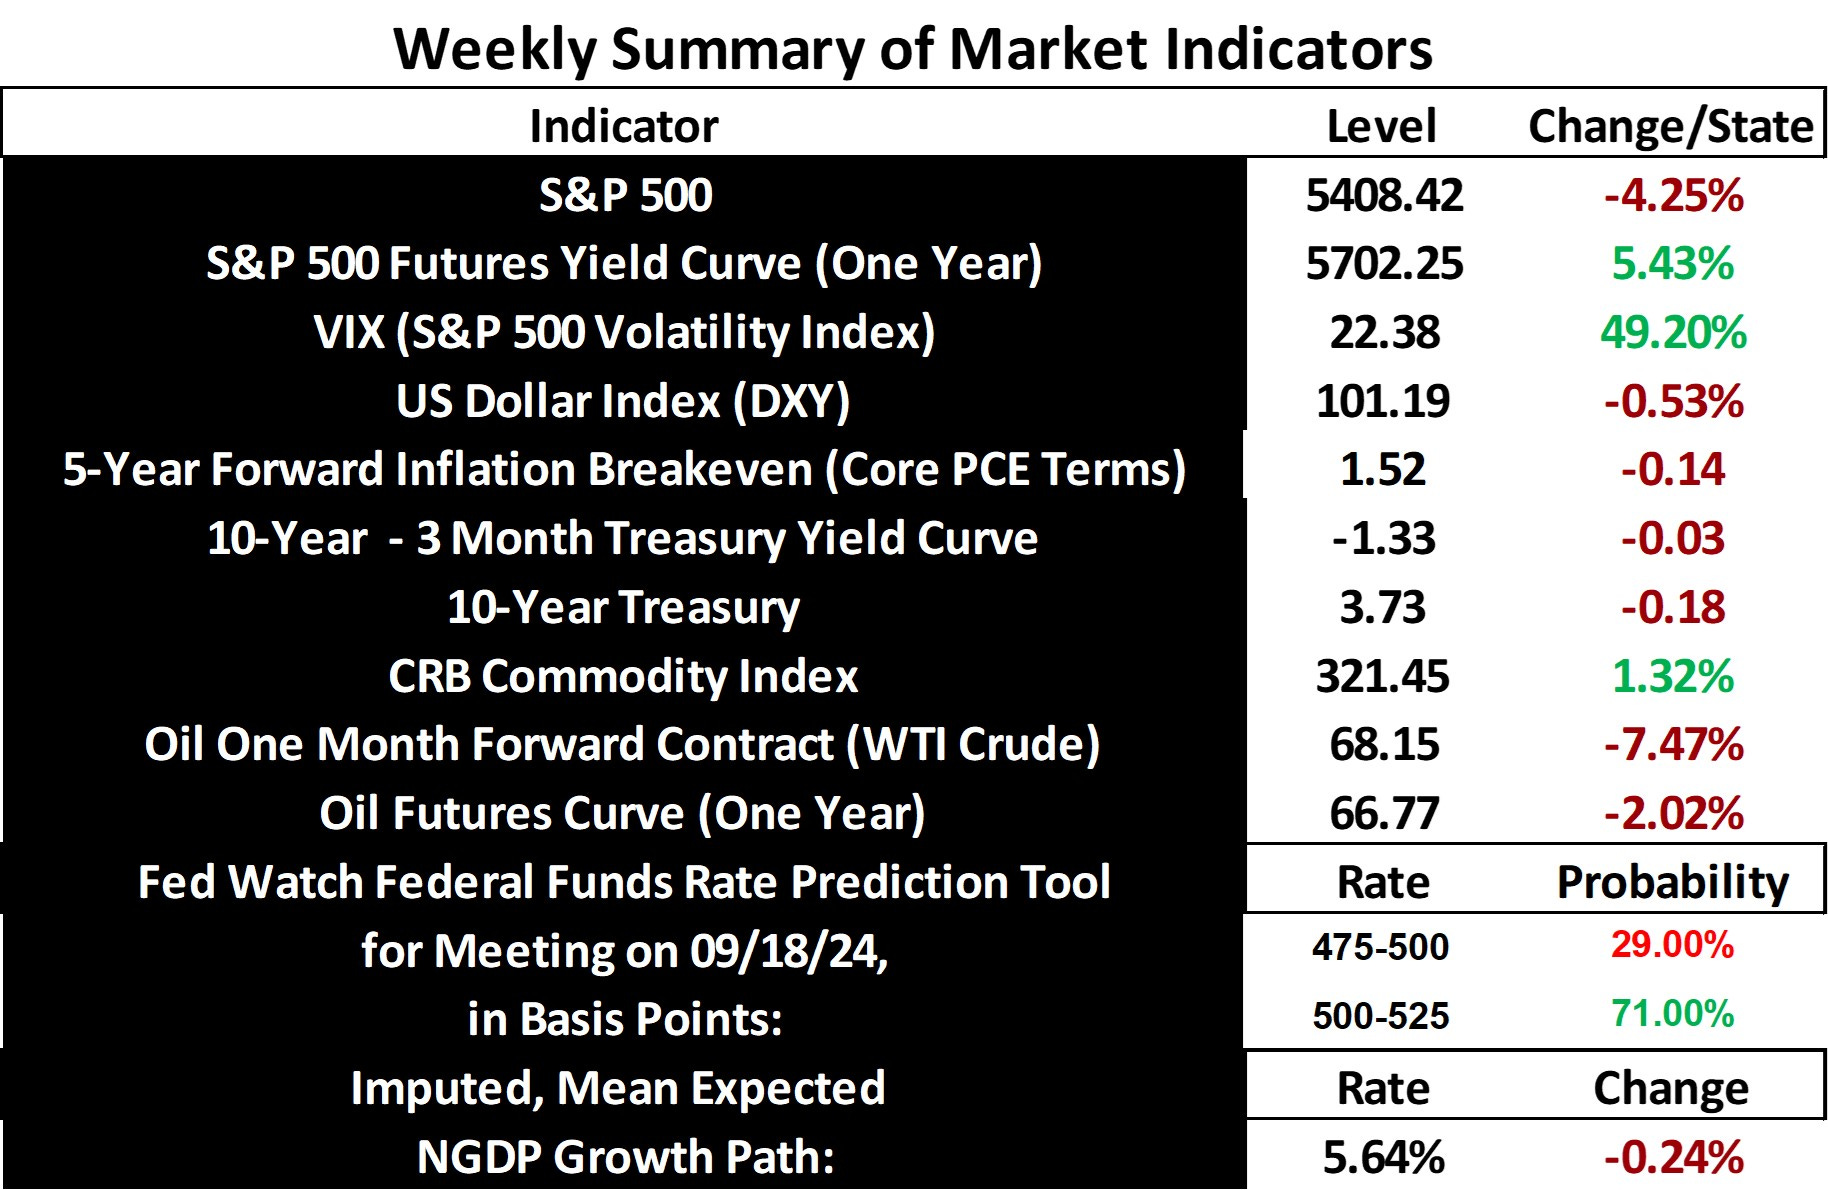
Stock prices and mean expected NGDP growth fell at the highest weekly rates since March of 2023, in part as a response to weaker-than-expected jobs numbers. This was likely due to real and nominal shocks, as the CRB commodity index rose, while inflation expectations fell, but not as sharply as stock prices. Expectations for a 50 basis points Fed Funds rate cut at the next meeting also fell.
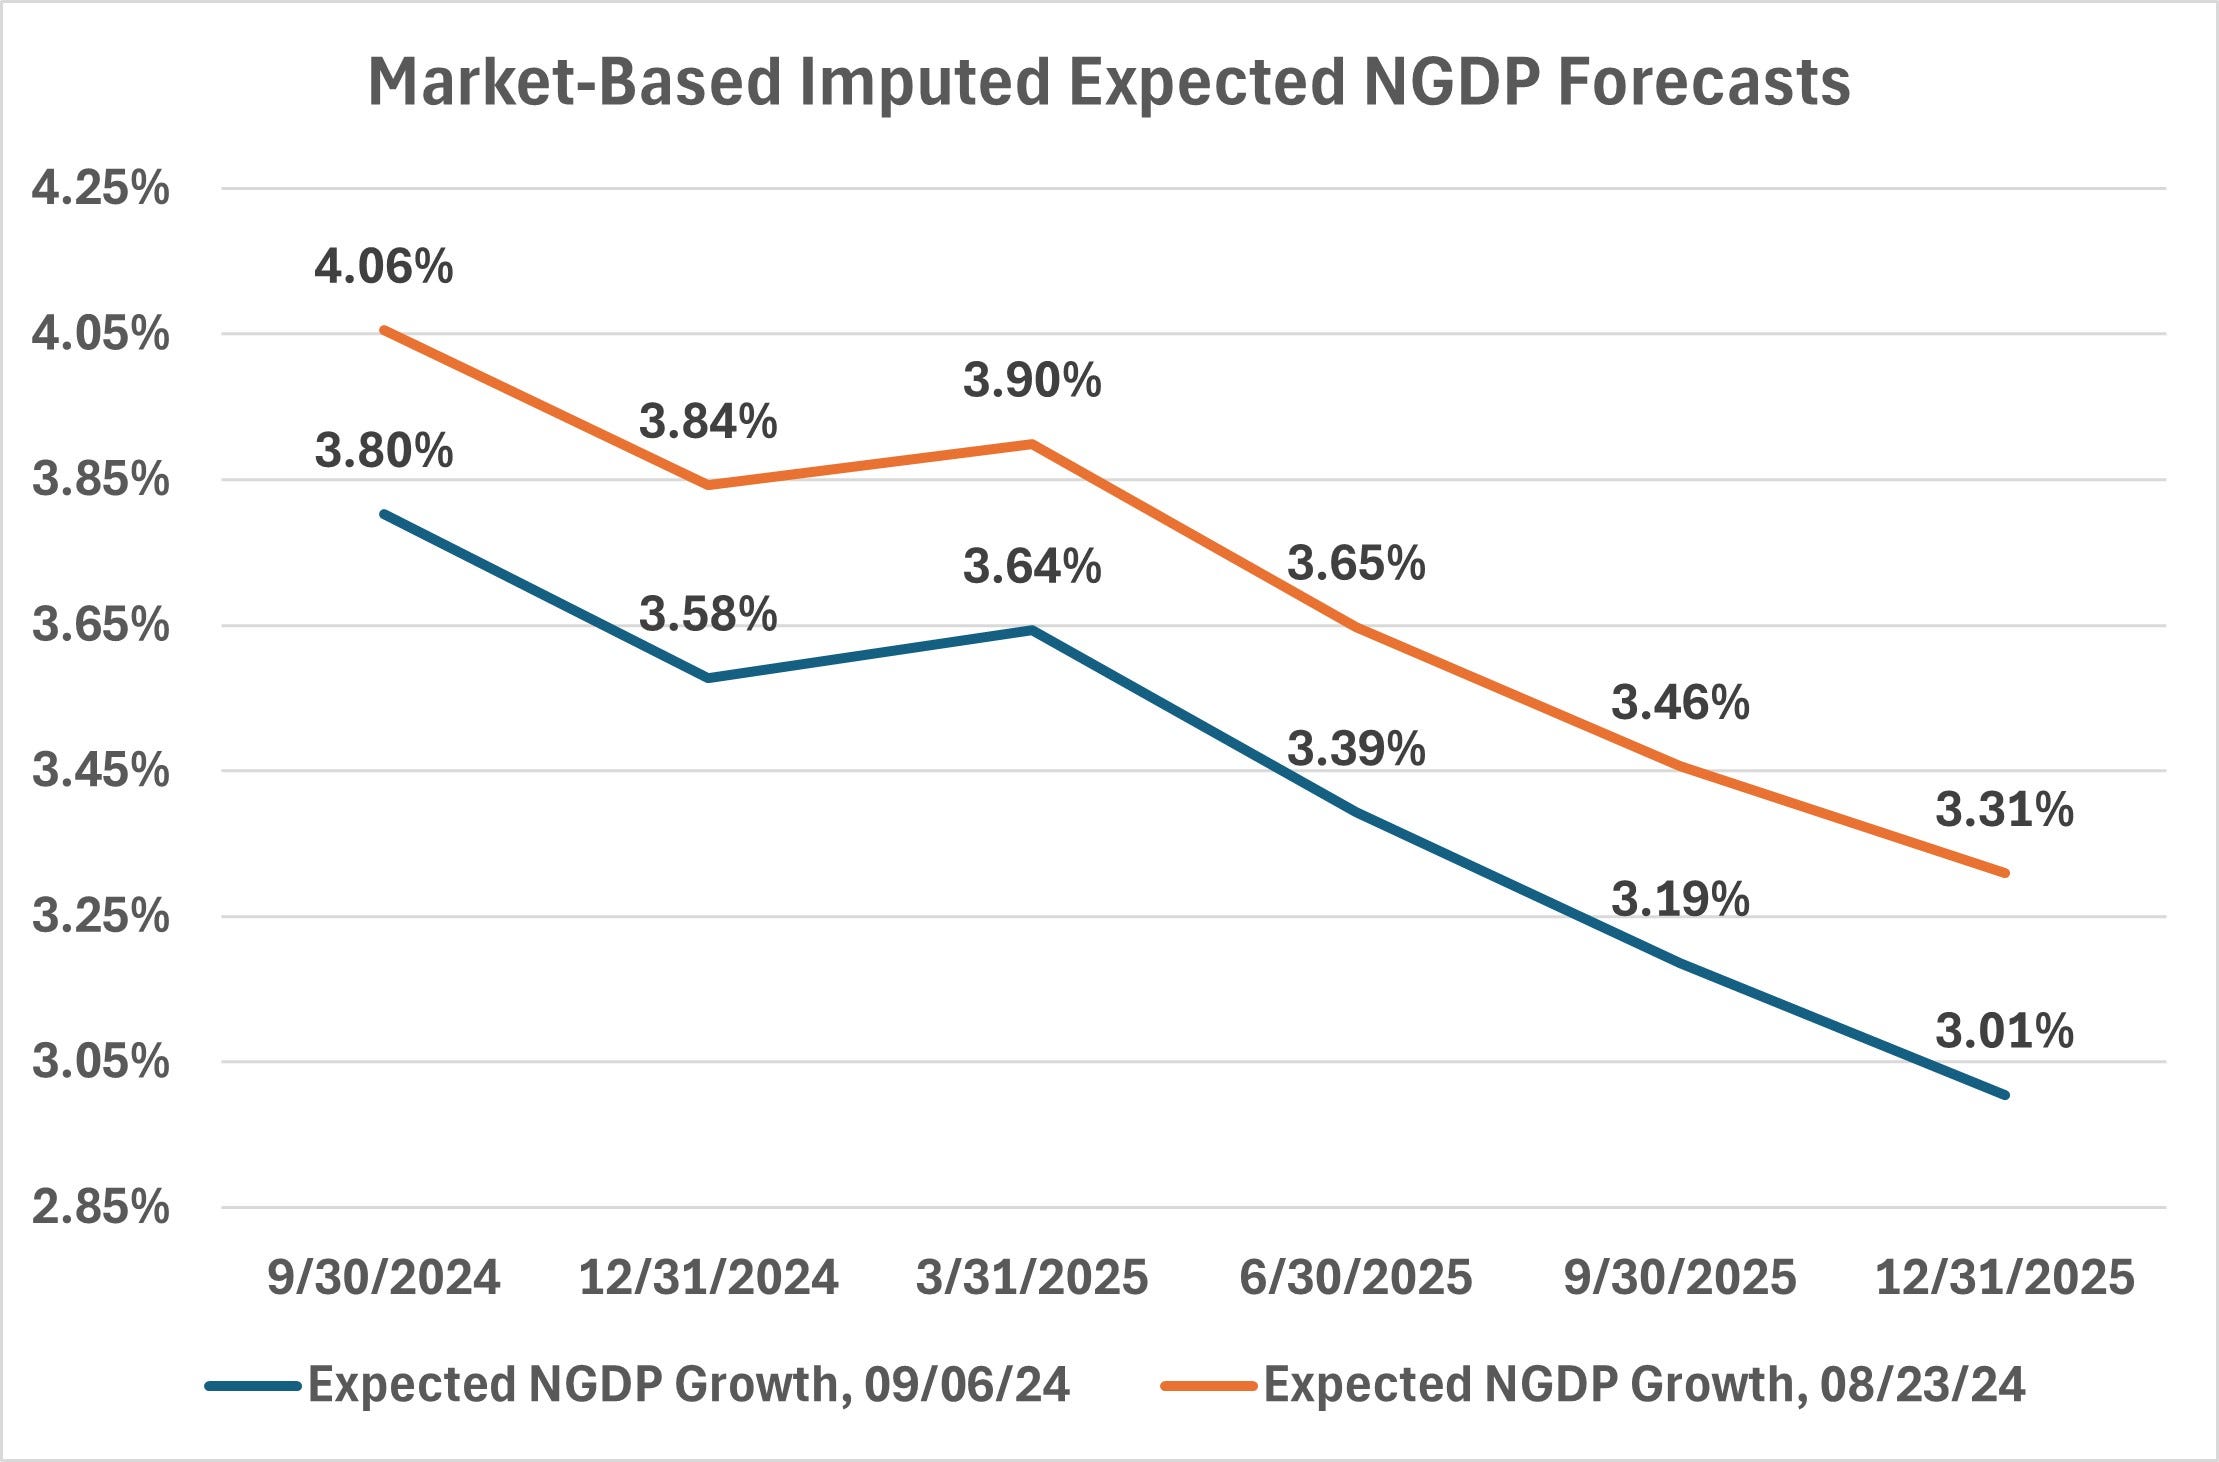
My back-of-the-envelope quarterly S&P 500 imputed NGDP growth forecasts fell in proportion to the decline in the mean expected NGDP growth rate, with the forecast path back to where it was in mid-August.
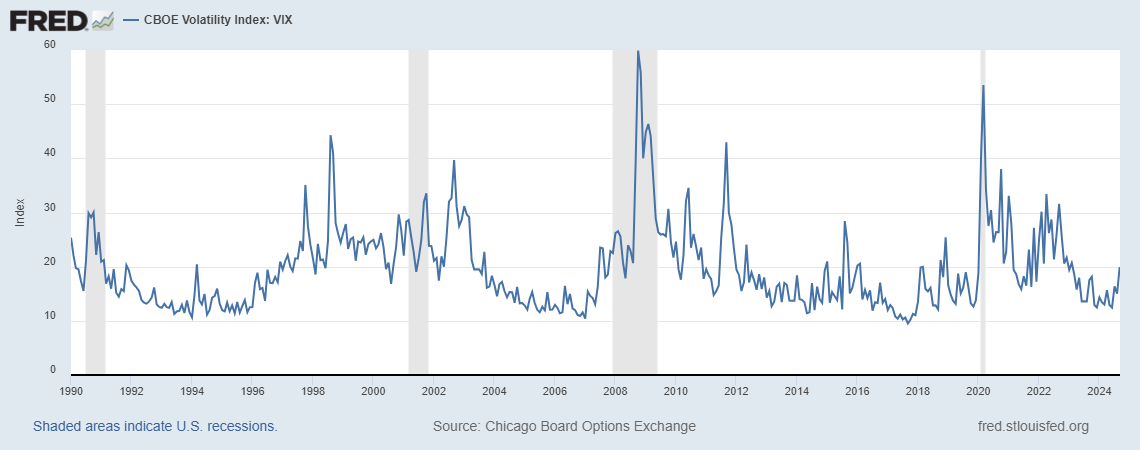
More revealing, however, was the rise of the VIX again near the range that would predict a recession, without Fed action. You can call this the “VIX rule of 26”. A VIX at a bit over 26 corresponds to a predicted 25% decline in the S&P 500 within 30 days, ceteris paribus, sans Fed action to prevent it. In turn, this predicts a proportionate fall in the expected NGDP growth rate, which is the breakeven point for continued growth versus a recession, assuming expected quarterly growth is a simple average spread over 4 quarters. This is is with a z-score of 3.29, which represents 99.9% confidence.
Historically, while not every rise in the VIX above this level has preceded recessions, all recessions since 1990 have followed the VIX rising above this level. Note that the Great Recession was not a continuous recession, as the economy dipped into a mild recession in late 2007, recovered into slow growth, and then plunged negative in late Q3 and in Q4 of 2008 and early 2009. also note that 1990 is the earliest date for this VIX data.
One might object that a VIX prediction should be interepreted as +/- 25%, and that’s true, but the VIX tends to rise with respect to fear of losses in the market, and in my view reflects a predicted loss, if nothing material changes. Material changes are usually in the form of Fed actions, but can also be due to real shocks, for example.
When the VIX briefly spiked to crisis levels last month, it was mostly due to unfolding nominal shocks in Japan and South Korea, which were threatening to put significant demand pressure on the Dollar, which would have required a Fed supply response, had their central banks not eased that pressure with their crisis responses. This latest spike is likely due to the Fed losing credibility, as shown in the continued decline of the 5-year inflation breakeven, which is nearly 50 basis points below its asymmetric mean target. This represents a potentially more dangerous threat for recession than the situation last month, as only the Fed can prevent NGDP growth expectations from continuing to slide.
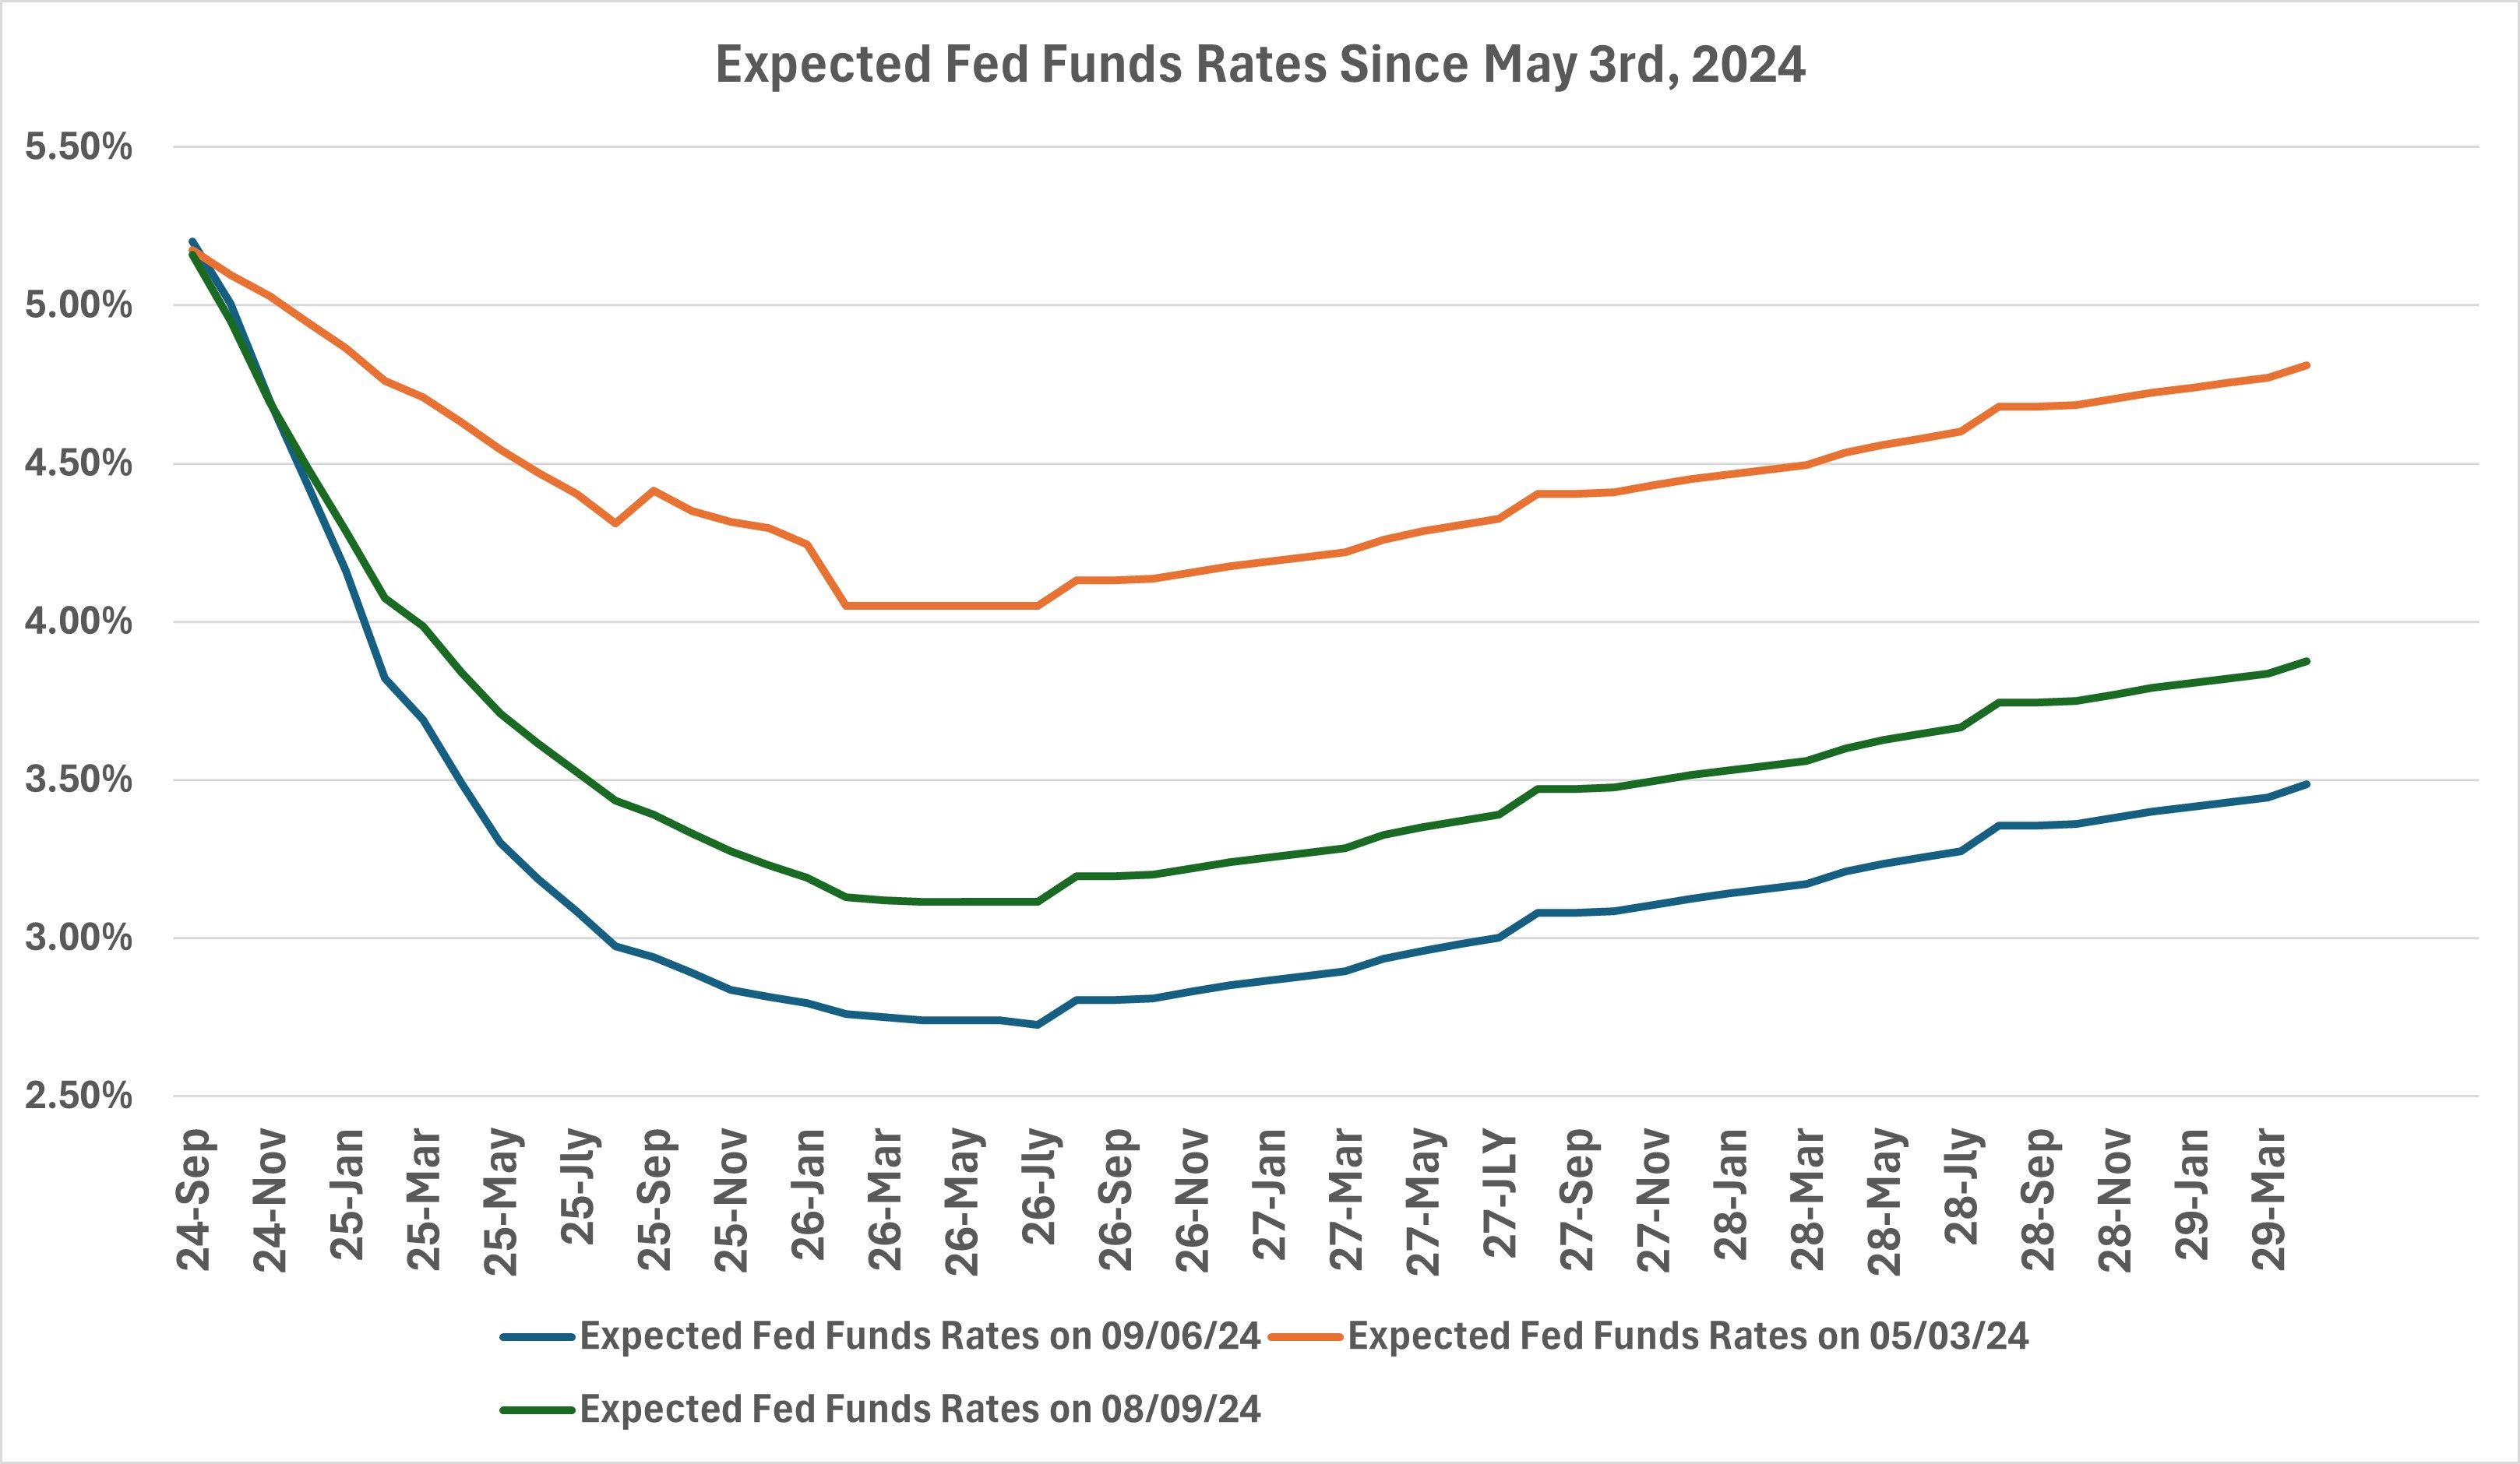
The view offered by the Fed Funds futures market is no brighter, with expected rate declines in proportion with those of the NGDP forecasts.
All considered, this is significant evidence that the Fed needs signal its willingness to do more to stem the expected decline in NGDP growth. If NGDP growth does turn out to be just over 4% for this quarter, and the trend continues downward from there, it would represent a trend that is well-below the sustainable NGDP growth rate when the economy is at its real potential.
Speaking of which, here is another indicator of sustainable NGDP growth, using the equilibrium relationship between the S&P 500 earnings yield and the NGDP growth rate:
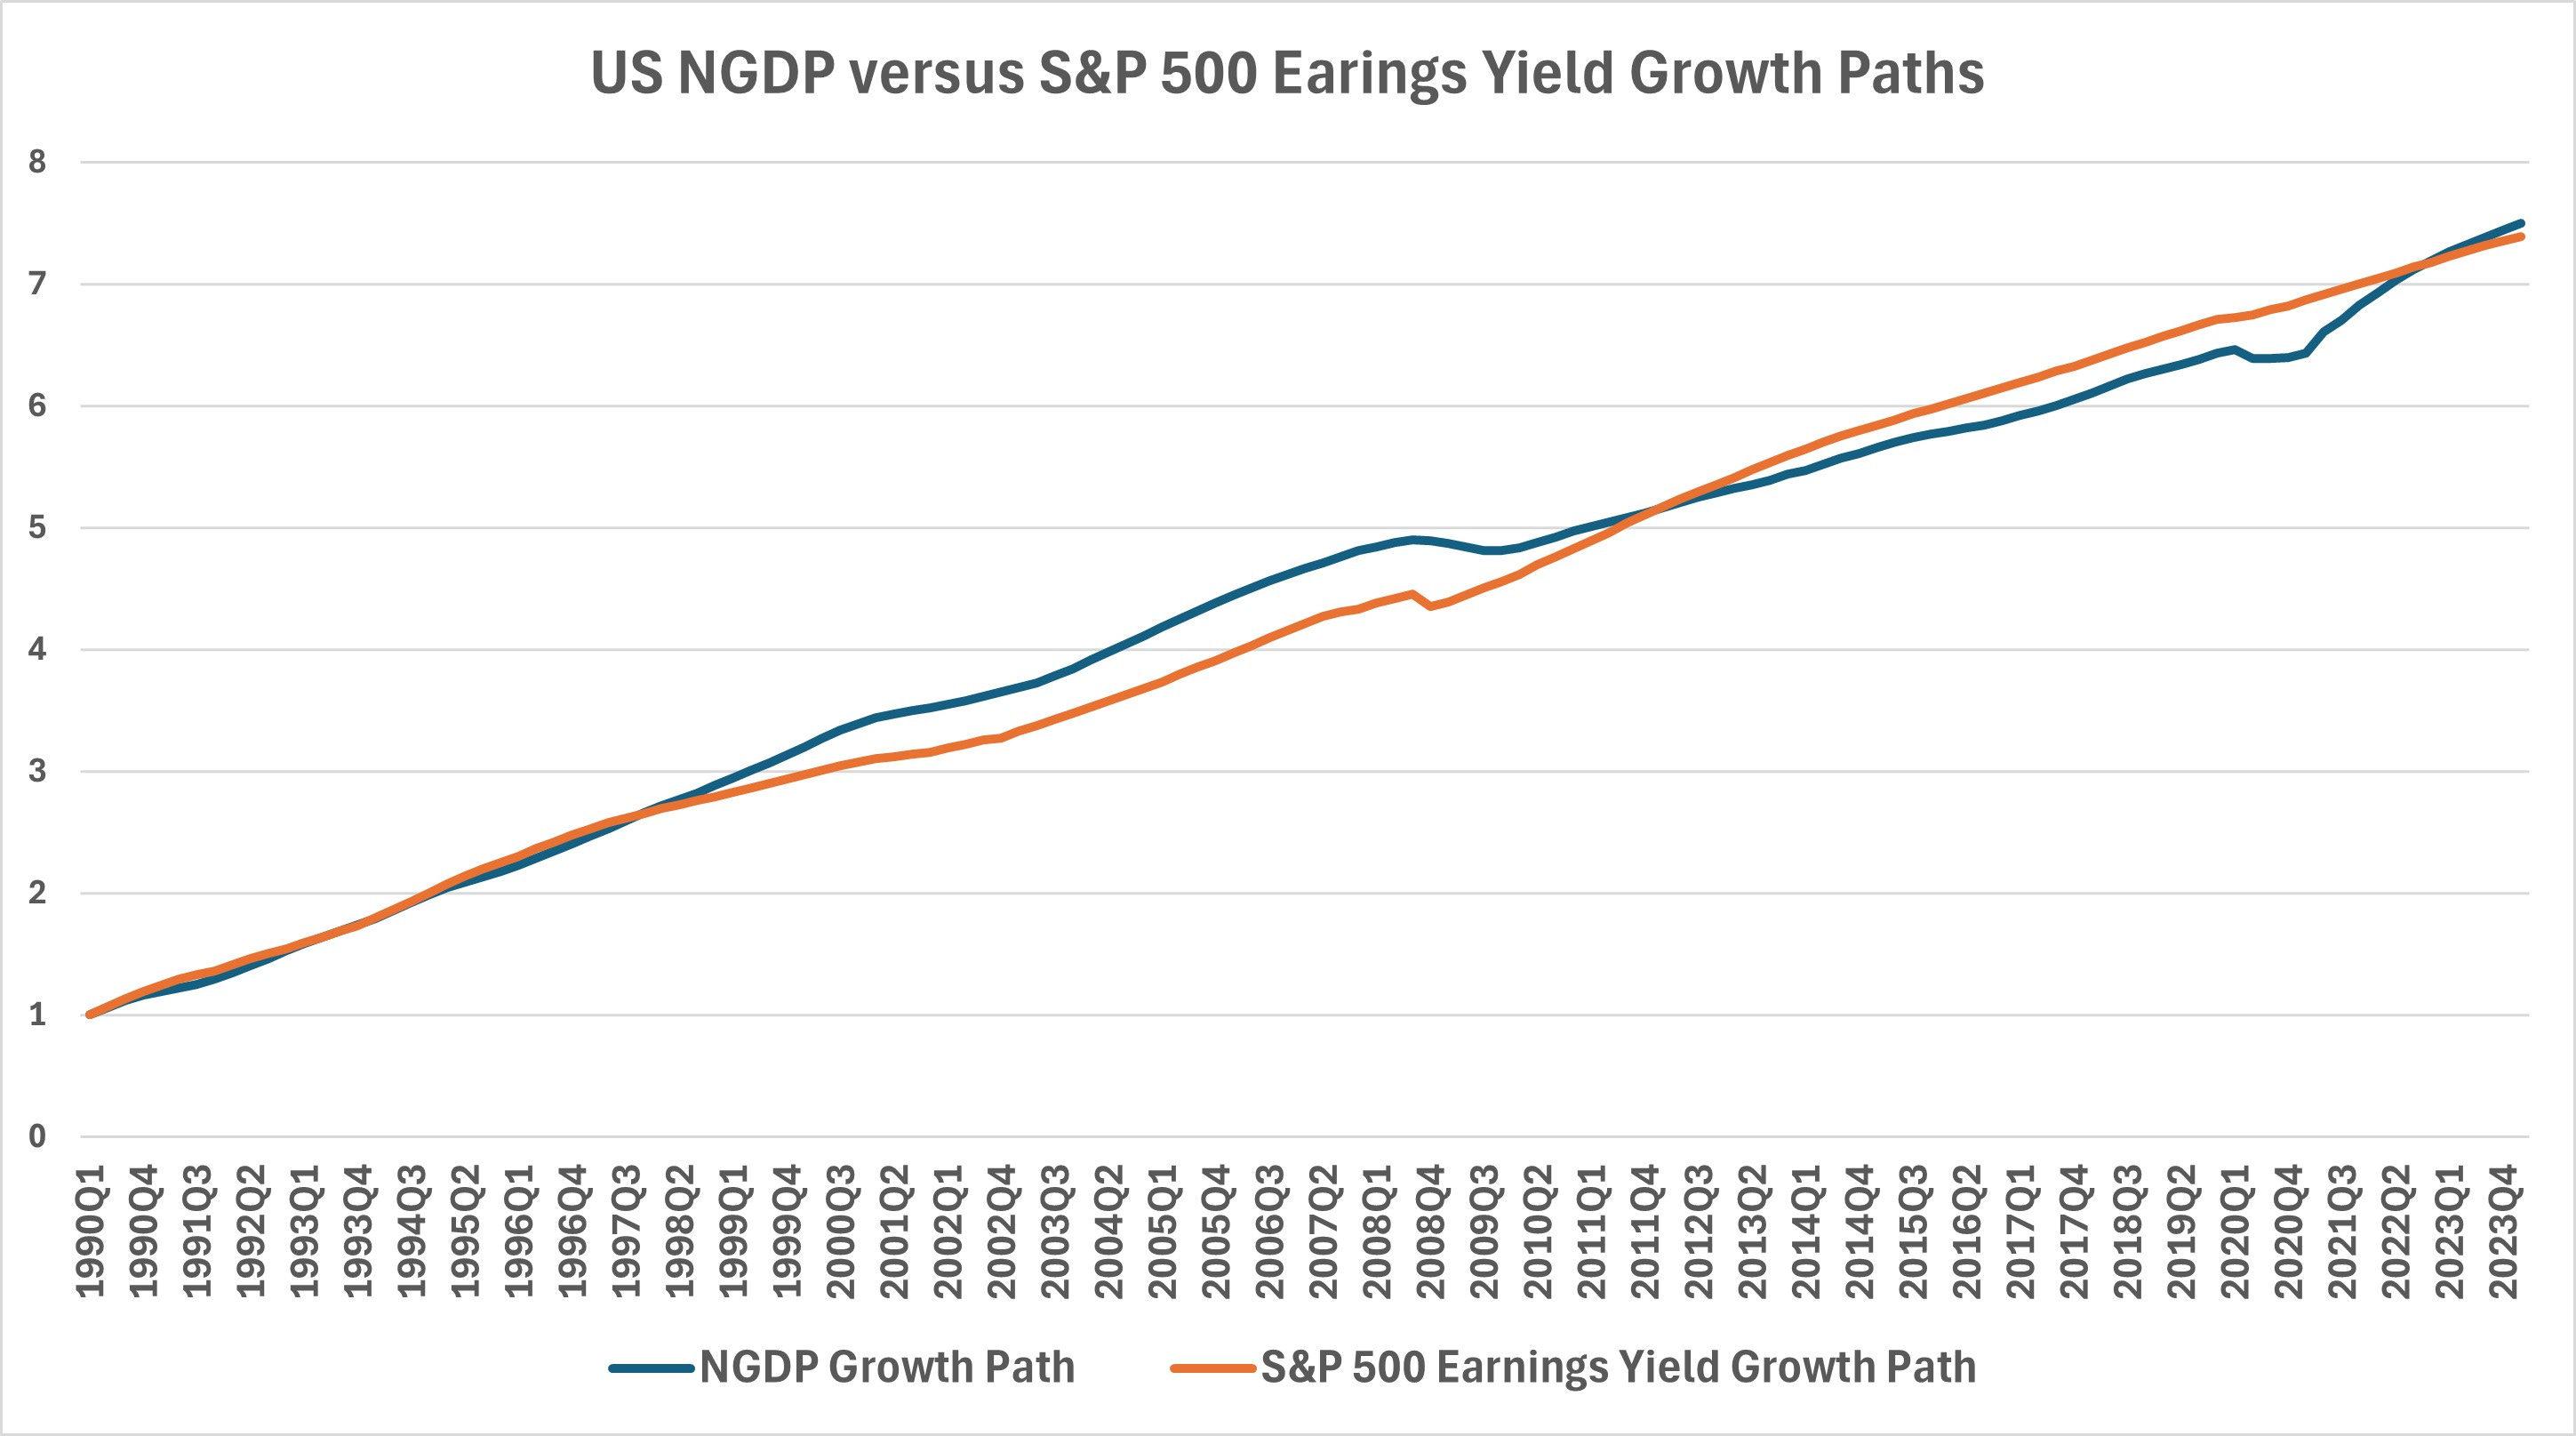
I should have thought of developing this earlier. This level approach to looking at the relationship between NGDP growth and the S&P 500 concurrent quarter earnings yield offers more comprehensive estimates of sustainable growth than the rate-based NGDP output gap measure. Notice that we only got back to a sustainable NGDP growth path in late 2023/early 2024. This adds important nuance to debates over growth potential, as quarterly rate comparisons, while informative, do not represent the whole picture. It supports for example, arguments that I and some others were making about the economy still being restrained in the late Great Recession recovery, in which the output gap had closed from a rate perspective, but not a level perspective. This can help explain why unemployment continued to decline until the end of that cycle.
More recently, I’d been moving to the opinion that the economy was further from sustainable growth than this path perspective suggests, putting too much weight on the rate-based output gap model. Marcus Nunes’ correct arguments, using conventional tools, convinced me to look at my model more closely, and I found his points well-supported. Sustainable US NGDP growth indeed seems to be at around 5%, with a 2% inflation target.
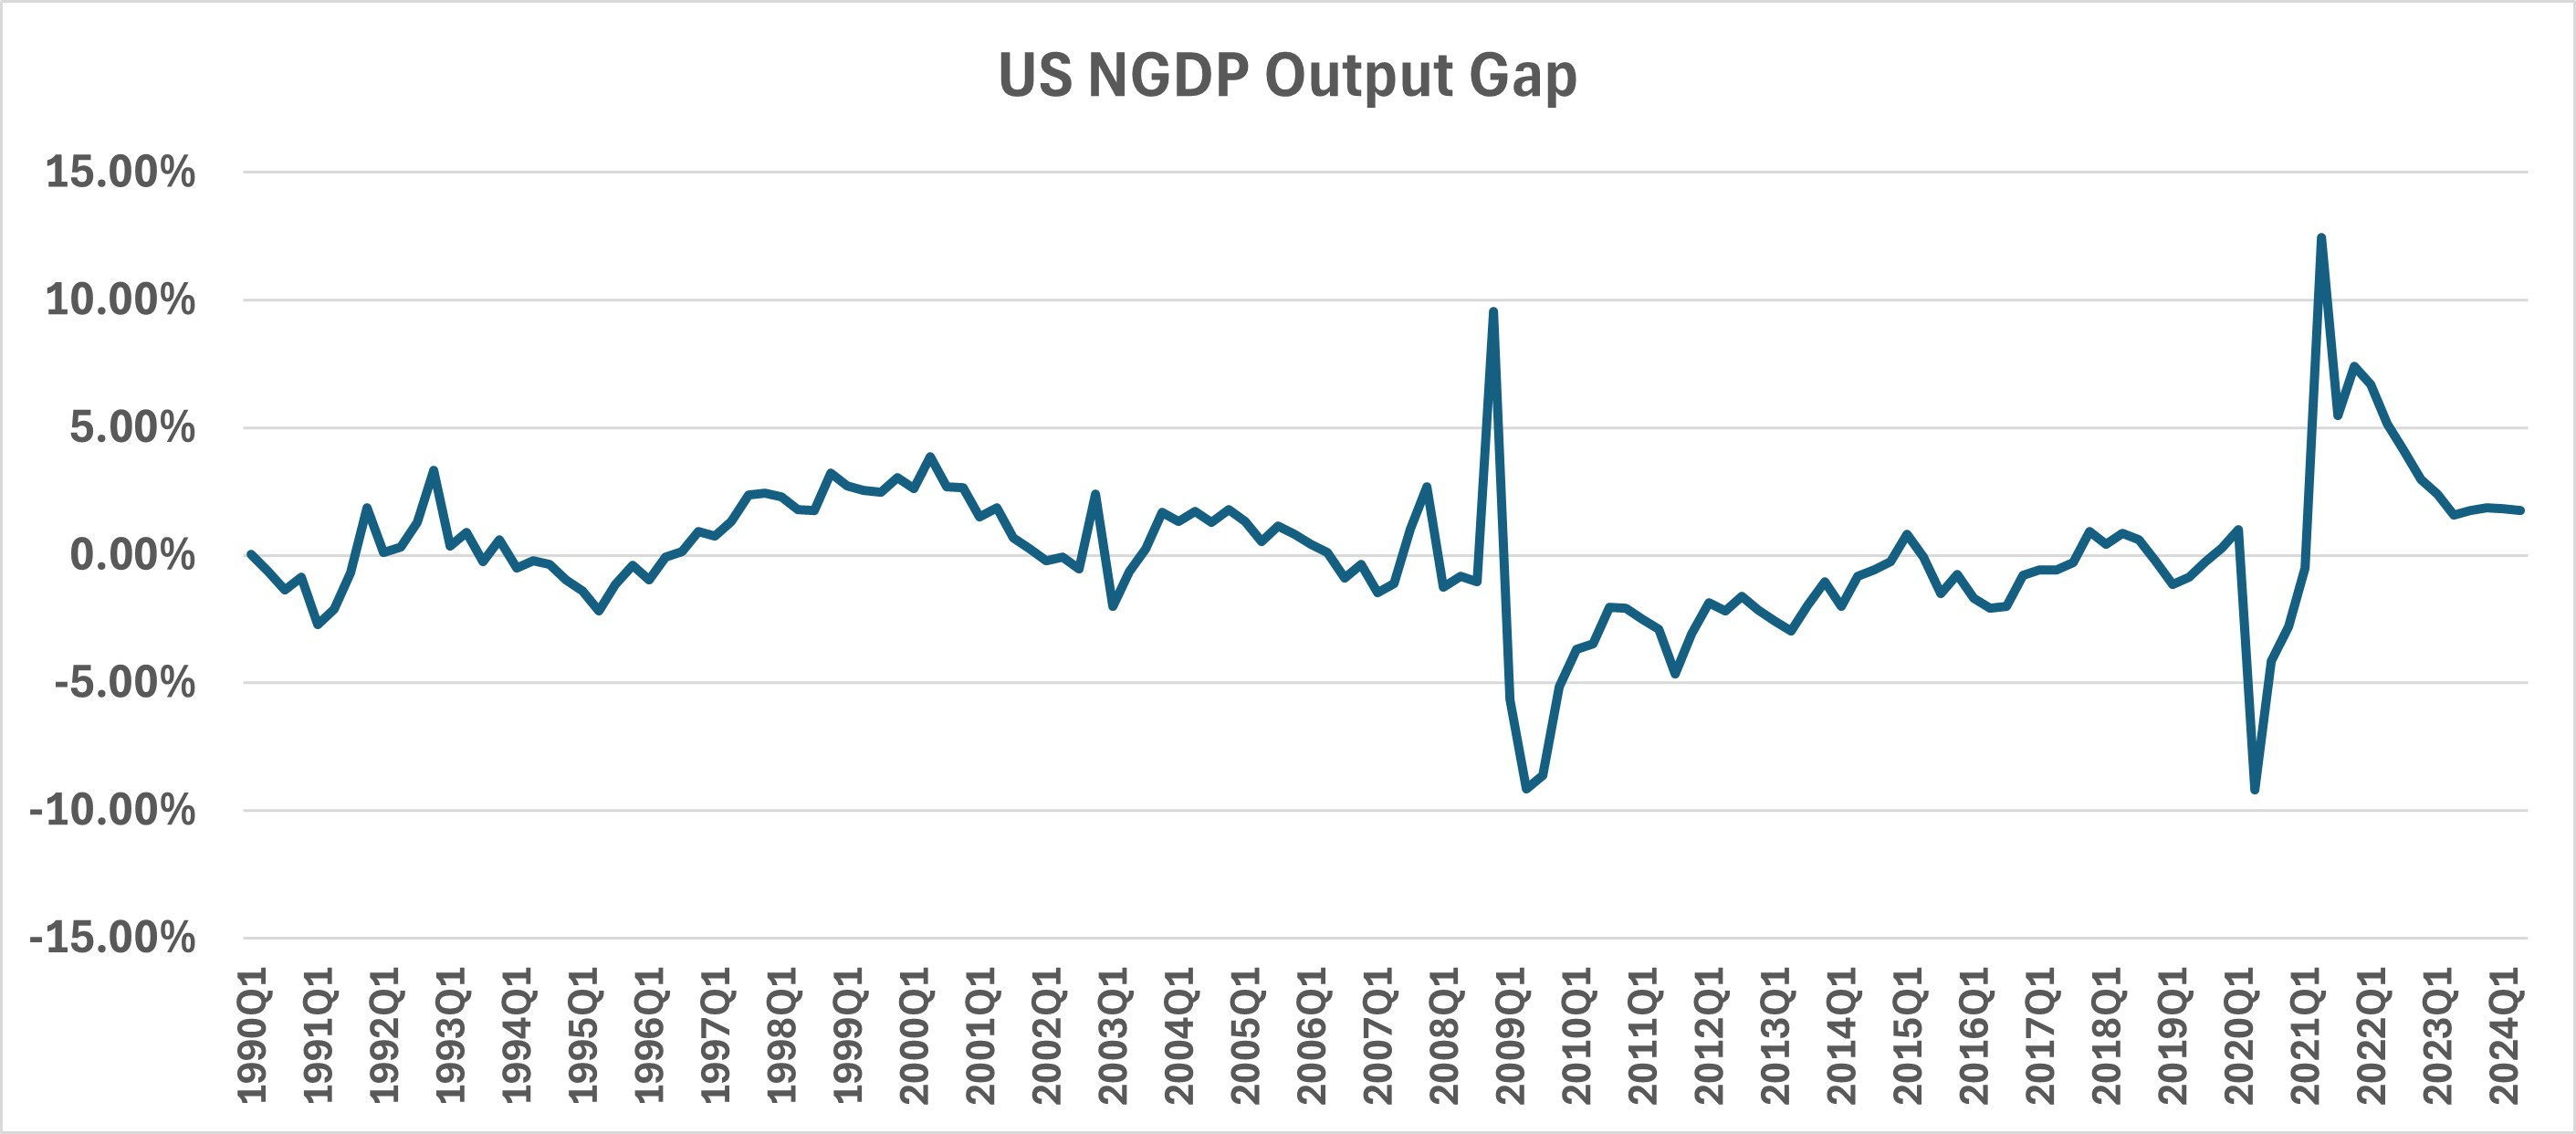
Hence, while I’ve mentioned the rate-based nature of the output gap indicator in the past, I’ll emphasize it more going forward. It will be titled the “US NGDP Output Rate Gap”, from now on.
Finally, I introduced the simple model I use in place of the Gordon Growth Model for stock valuation, in which expected NGDP growth replaces the traditional discount rate. A short paper on the model can be found here. I present it this way, because there is a derivation presented, and it was much easier to format in LaTex than to manually type it into Word, for example. Also, it looks nicer in this format. I need to develop a more comprehensive explanation on the model at some point, which includes the equilibrium relationship between NGDP growth and the S&P 500 earnings yield.
This model, by replacing the discount rate in the Gordon Growth Model, helps explain situations of stagnation in stock markets co-occurring with low or even negative real and nominal interest rates. It also helps explain how high PE ratios can reflect catch up growth potential, when earnings are on a lower growth path, along with NGDP growth.
My presentation of the paper in the comment section of Scott Sumner’s old blog was clumsy to say the least, reflecting my general nature, especially when I rush too much, in the midst of a busy schedule. It’s no excuse, but an explanation. You’re warned that the ads on his old blog are so intrusive, it makes reading comments and especially adding them a truly frustrating chore, particularly for the uninitiated.
I hope to have announcements soon about upgrades to the chatbot in the user guide, which will add features such as the ability to obtain metrics used in this blog on a daily, or even real time basis. My paper on the replacement for the Gordon Growth Model is also there, for those who want more information about it. Of course, I’m also open to questions and comments.
Note: This post, as is the case with all my posts, should not be construed as offering investment advice. Such advice should be tailored to the individual investor by qualified professionals who, ideally, are fiduciaries.
Links to Data: